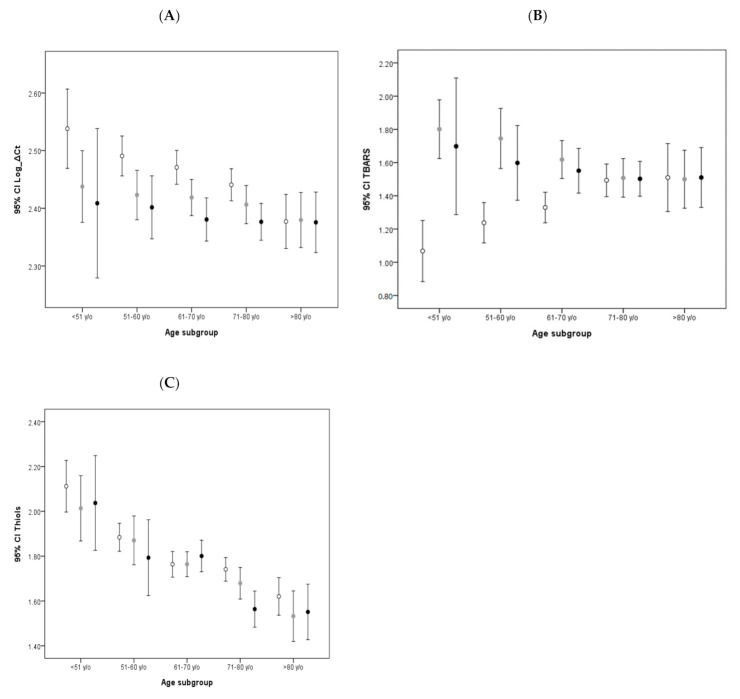
Figure 3.
Age-stratified comparison of influences of various total equivalent dopamine doses (TEDDs) on oxidative stress markers and mtDNA copy number: Error bar plots show levels of average Log Ct copy number (A), TBARS (B), and thiols (C) in different TEDD subgroups of PD patients and non-PD controls. (● in (A–C) represents higher dopamine dose group of PD patients; ● in (A–C) represents lower dopamine dose group of PD patients; ○ in (A–C) represents dopamine-naive group of non-PD controls).

