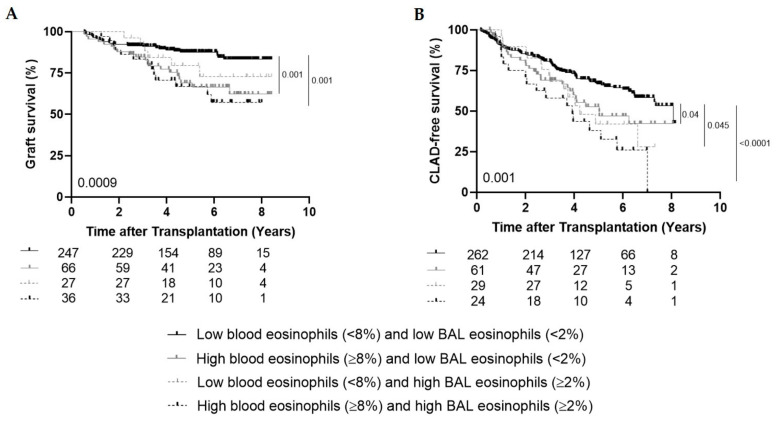
Figure 2.
High blood (≥8%) and high BAL (≥2%) eosinophils. (A), Kaplan–Meier curve comparing graft survival (%) between the group with low blood and low BAL eosinophils (n = 247), the group with high blood and low BAL eosinophils (n = 66), the group with low blood and high BAL eosinophils (n = 27) and the group with both high blood and high BAL eosinophils (n = 36) (p = 0.0009). (B), Kaplan–Meier curve comparing CLAD-free survival (%) between the group with low blood and low BAL eosinophils (n = 262), the group with high blood and low BAL eosinophils (n = 61), the group with low blood and high BAL eosinophils (n = 29) and the group with both high blood and high BAL eosinophils (n = 24) (p = 0.001).

