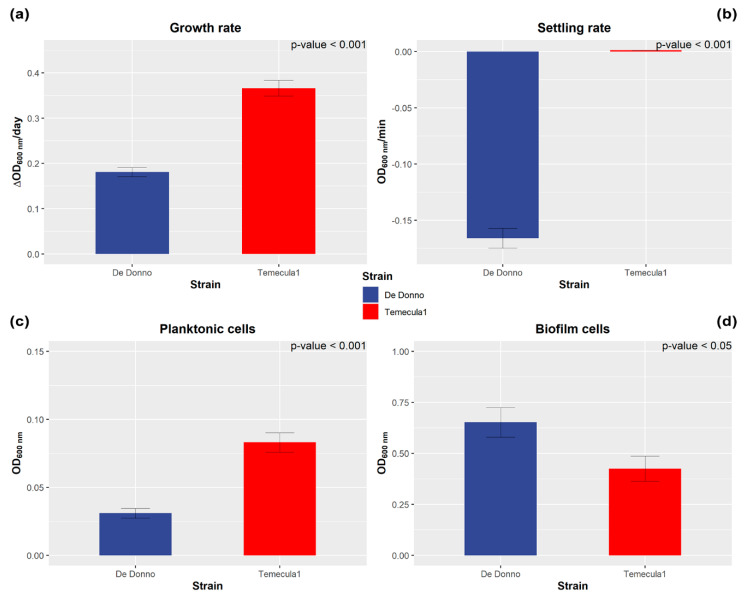
Figure 2.
Comparison of biological traits between X. fastidiosa strains Temecula1 and De Donno. Both strains were grown in the PD3 medium. The growth rate (a) was calculated from the growth curve at the exponential phase (1–4 dpi). Settling rate (b) was assessed by suspending bacterial culture in a 1 mL-cuvette and continuously measuring optical density for 3 min. Planktonic growth (c) was assessed by measuring optical density (OD) at the end of the growth-curve experiment (7 dpi). Biofilm formation (d) was assessed by measuring OD, using crystal violet staining in the 96-well plates, at the end of the growth-curve experiment (7 dpi). Experiments (a–d) were repeated independently three times. For 96-well plate assays (a,c,d) 6 wells per plate and 3 plates per experiment were used for each strain. Error bars indicate the standard error of the mean. OD was measured at 600 nm wavelength. p-values show statistically significant differences between strains, as assessed by a Student’s t-test at the 5% significance level.

