Figure 5.
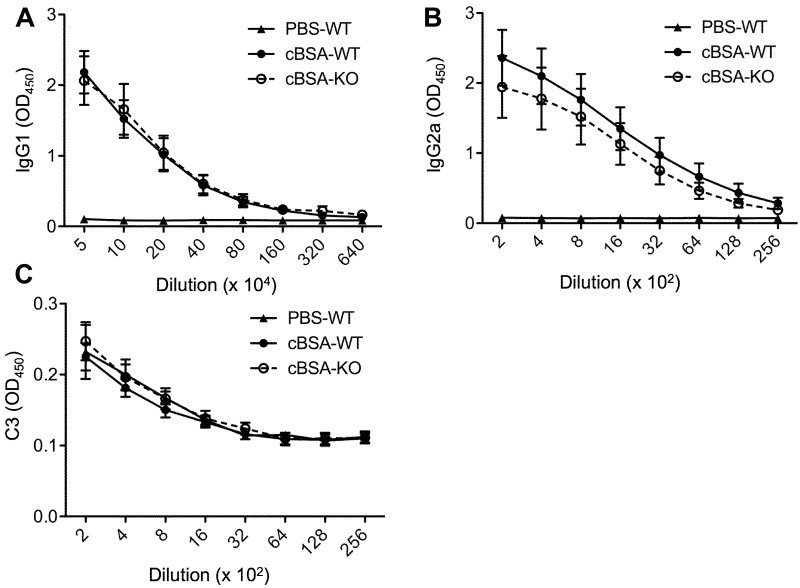
Serum levels of anti-cBSA IgG and C3 after cBSA immunization. The serum anti-cBSA IgG subclasses and C3 were measured in PBS-WT (n = 3), cBSA-WT (n = 12) or cBSA-KO (n = 11) by using ELISA. (A) IgG1 was measured in the serum samples serially diluted from 1:50,000. p = 0.7822 (cBSA-KO vs cBSA-WT); p < 0.0001 (PBS-WT vs cBSA-WT). (B) IgG2a was measured in the serum samples serially diluted from 1:200. p = 0.1141 (cBSA-KO vs cBSA-WT); p < 0.0001 (PBS-WT vs cBSA-WT). (C) C3 was measured in the serum samples serially diluted from 1:200. p = 0.1783 (cBSA-KO vs cBSA-WT); p = 0.4792 (PBS-WT vs cBSA-WT).

