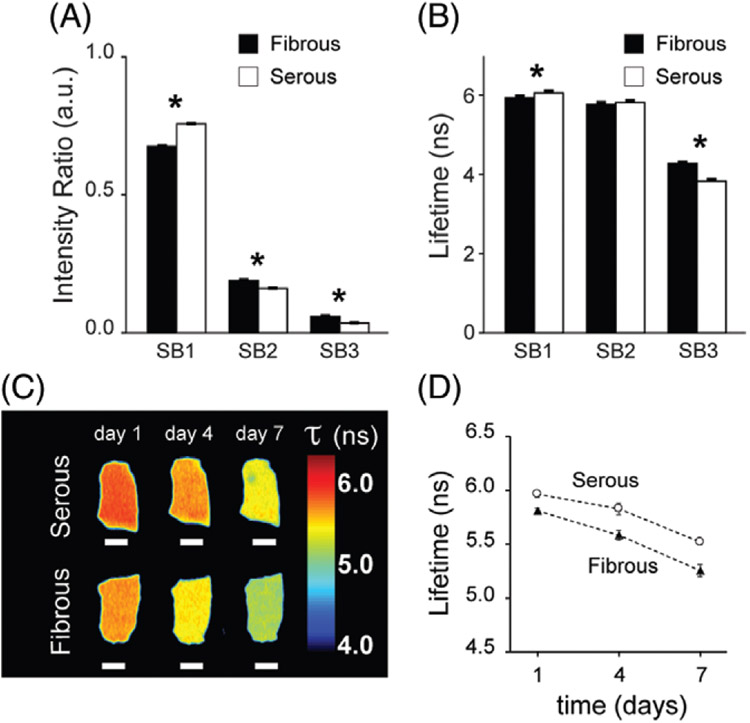
FIGURE 2.
Antigen removed bovine pericardium (AR-BP) fluorescence lifetime properties. (A) Fluorescence intensity ratio detected at each spectral band (SB) for the fibrous and the serous sides of the scaffolds. (B) Average fluorescence lifetime at each SB for both sides. N =8 scaffolds per side. Paired t test :* P < .05. (C) Representative fluorescence lifetime maps in SB1 of the serous (top) and the fibrous (bottom) side of AR-BP scaffolds in PBS culture for 7 days. Scale bars = 2 mm. (D) Average fluorescence lifetime drift over the 7 days in culture, for both sides, n = 3. Error bars indicate standard deviation

