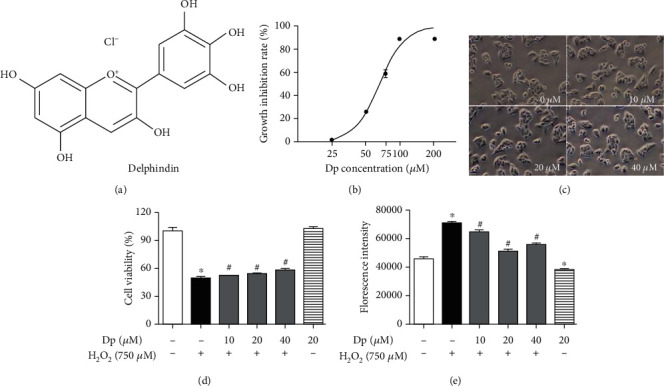
Figure 1.

Effect of delphinidin on cell viability and the generation of ROS level induced by H2O2: (a) a chemical structure of delphinidin; (b) growth inhibition rate of HepG2 cells treated with different concentrations of delphinidin; (c) morphological observation of HepG2 cells treated with different concentrations of delphinidin; (d) cell viability of HepG2 cells treated with delphinidin and H2O2; (e) effects of delphinidin (10 μM, 20 μM, and 40 μM) on intracellular ROS levels induced by H2O2. Values were presented as mean ± SD. ∗P < 0.05 vs. the control group and #P < 0.05 vs. the H2O2-treated group.
