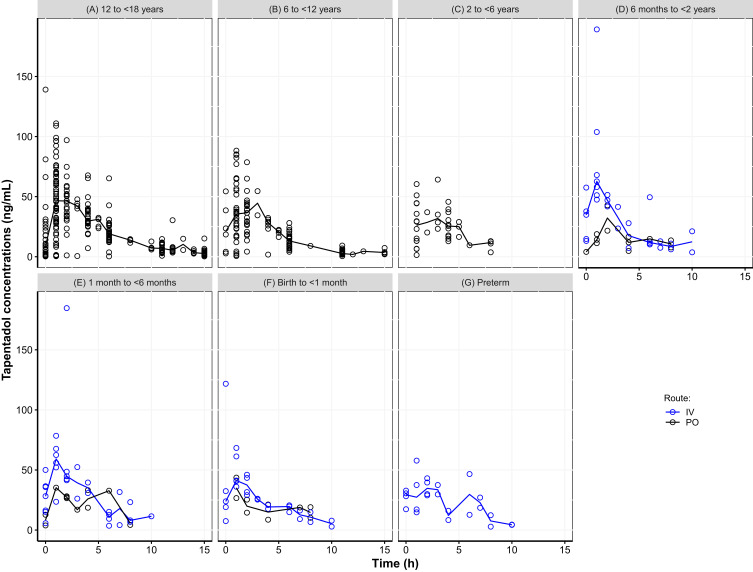
Figure 1.
Scatter plot of observed tapentadol concentrations versus time. (A) 12 to <18 years, (B) 6 to <12 years, (C) 2 to <6 years, (D) 6 months to <2 years, (E) 1 month to <6 months, (F) Birth to <1 month, (G) Preterm. The open circles represent the observed tapentadol concentrations and the lines represent the observed median concentrations.
Abbreviations: IV, intravenous; PO, oral.

