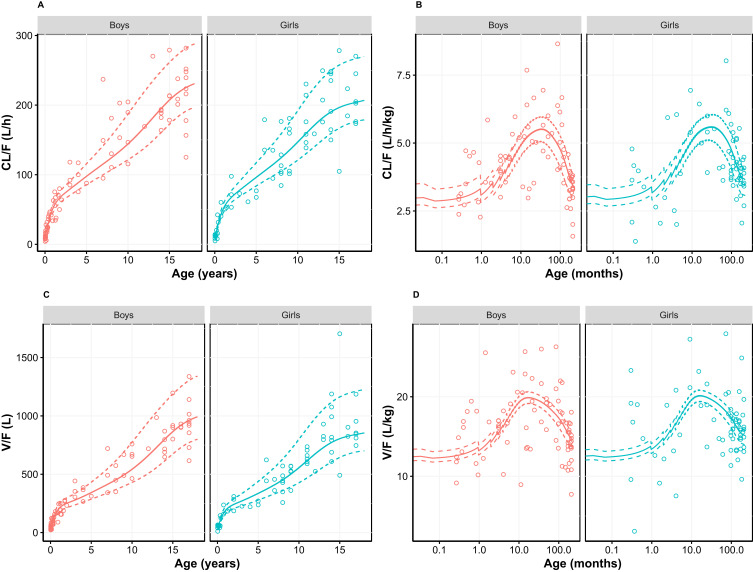
Figure 5.
(A) Apparent clearance, (B) bodyweight-normalized apparent clearance, (C) apparent distribution volume, and (D) bodyweight-normalized apparent distribution volume versus age, using allometric scaling with estimated exponents (Table 3). Empirical Bayesian estimates (dots) are shown together with simulated relationship (median weight-for-age (solid line) as well as the 3rd and 97th weight-for-age percentile (dashed lines) of the CDC growth charts). Empirical Bayesian estimates of all results are scaled to age-specific oral bioavailability and stratified by gender. For bodyweight-normalized values, data were presented on logarithmic x-axis.
Abbreviation: CDC, Centers for Disease Control and Prevention.

