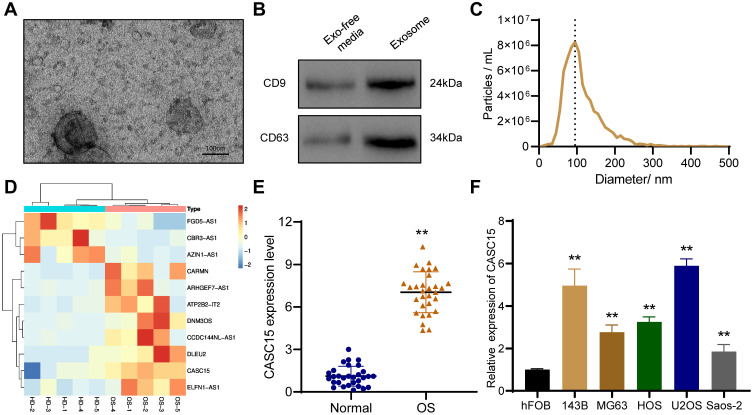
Figure 1.
The expression and function of CASC15 in OS. (A) Representative image of exosomes under TEM. (B) Western blot showed the presence of exosome surface marker proteins CD9 and CD63. (C) NTA was used to analyze the size distribution of exosomes. (D) Heat map represents the dysregulated lncRNAs in plasma exosomes of OS patients. (E) CASC15 was significantly upregulated in OS tissues. (F) CASC15 was highly expressed in OS cell lines. **p < 0.01.

