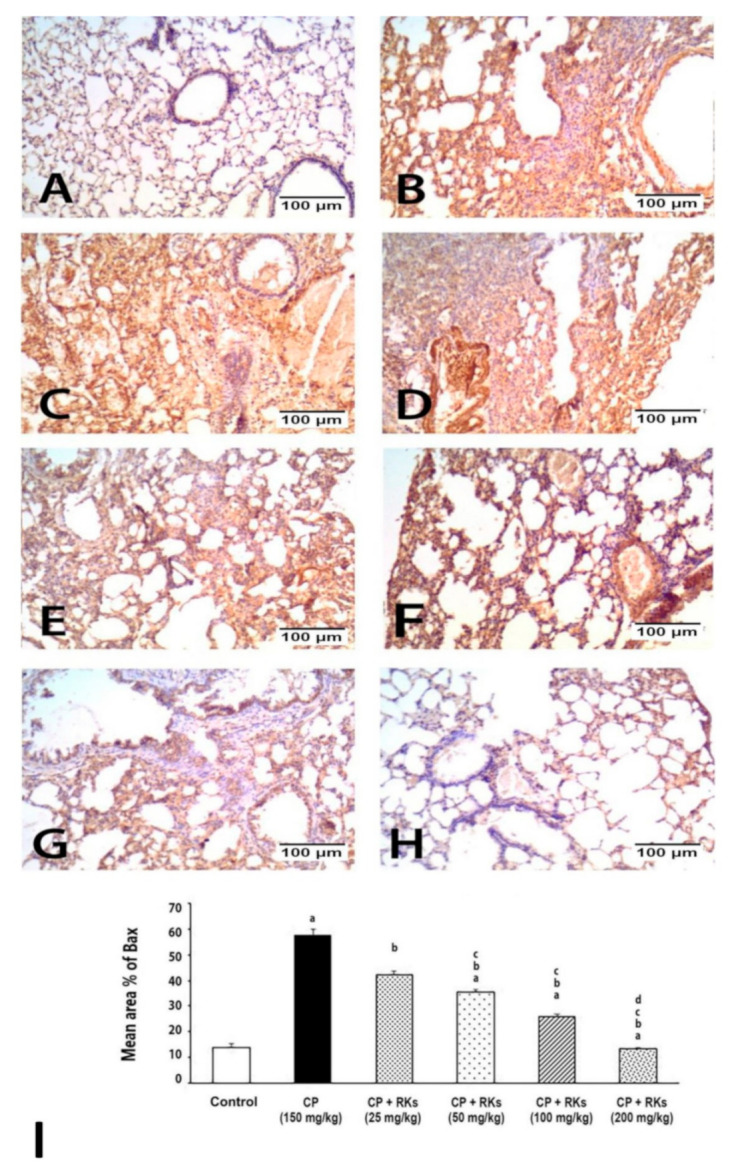
Figure 3.

Photomicrographs showing Bax immunoexpression on the lung tissue of different experimental groups. (A) Negative to weakly immunoreactivity control group. (B–D) strong immunoreactivity of CP group. Immunoreactivity to Bax was decreased as the dose of RKs increased as shown in (E) RKs 25 mg/kg, (F) RKs 50 mg/kg, (G) RKs 100 mg/kg and (H) RKs 200 mg/kg. (I) graph of the mean area % of immunoreaction to Bax. Results are expressed as mean ± S.E. and analyzed using One Way ANOVA followed by Bonferroni’s post-hoc test at p ≤ 0.05 (n = 4–6). a Indicates significant differences from +control (Control) mice. b Indicates significant differences from CP, c Indicates significant differences from RKs (25 mg/kg/p.o), d Indicates significant different from RKs (50 mg/kg/p.o.).
