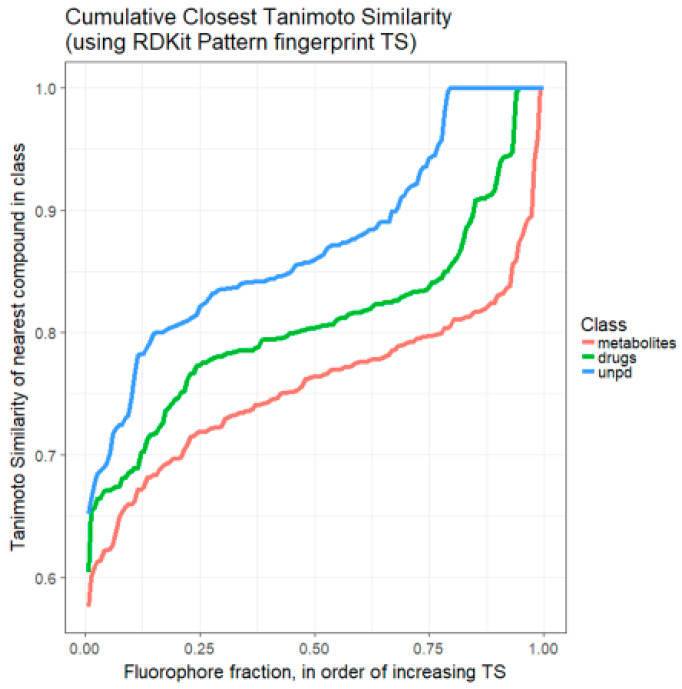
Figure 2.
Ranked order of Tanimoto similarity for fluorophores vs. marketed drugs (green line/—), fluorophores vs. Recon2 metabolites (red line/—), and fluorophores vs. a 2000-member sampling of UNPD (blue line/—). Each fluorophore was encoded using the RDKit ‘Patterned’ encoding, then the Tanimoto similarity for it was calculated against each drug, metabolite or natural product sample. The highest value of TS for each fluorophore was recorded and those values ranked. Read from right to left.

