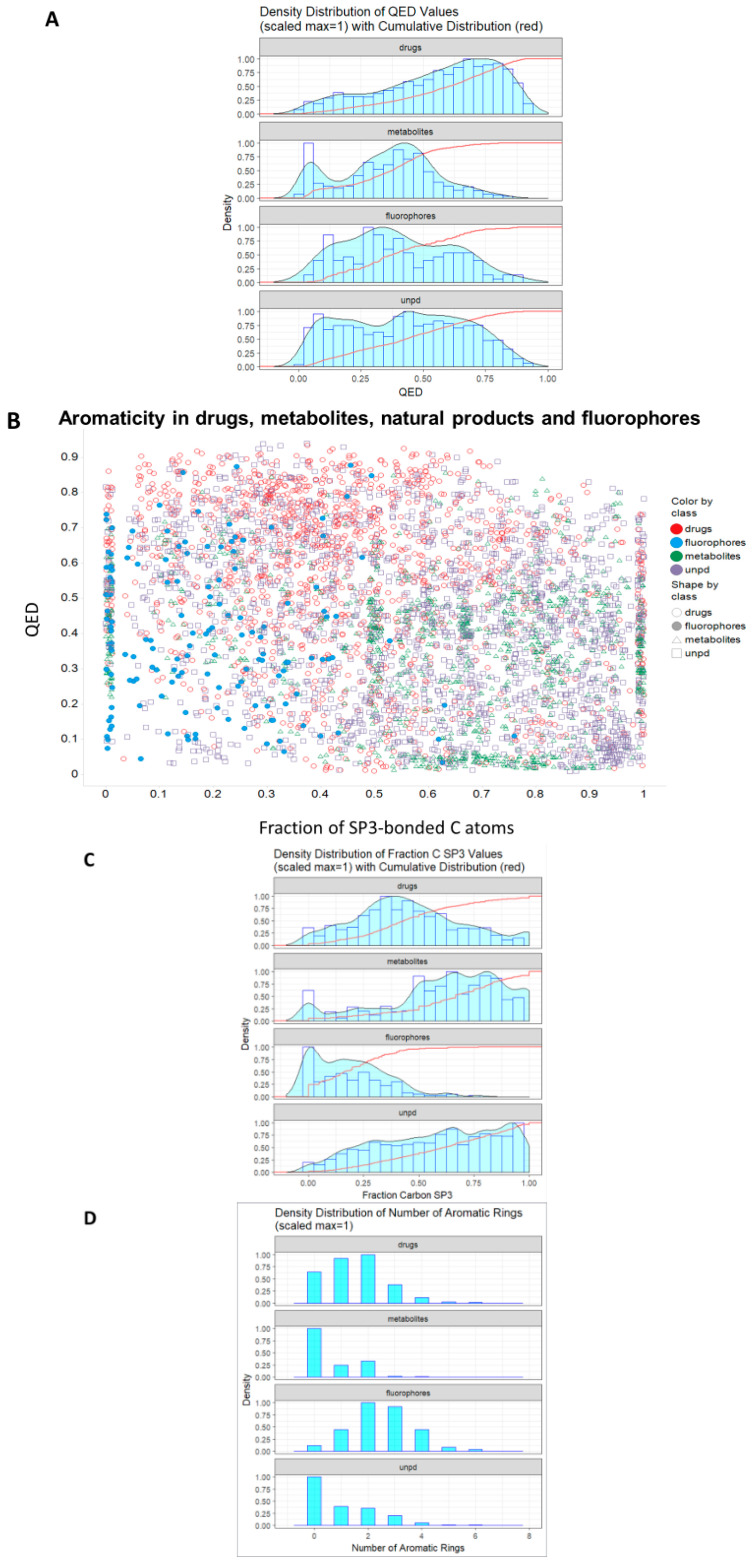
Figure 5.
Distribution of quantitative estimate of drug-likeness (QED) values in different classes of molecule. (A). Cumulative distributions for the four classes. (B). Relationship between QED and aromaticity for the four classes as encoded by the fraction of C atoms exhibiting sp3 bonding. QED values were calculated using the RDKit Python code as described in Methods and plotted in (A) using ggplot2 and in (B) using Spotfire. (C). Density distribution of fraction of C atoms with sp3 bonding. (D). Histogram of distributions of numbers of aromatic rings in the four given classes.

