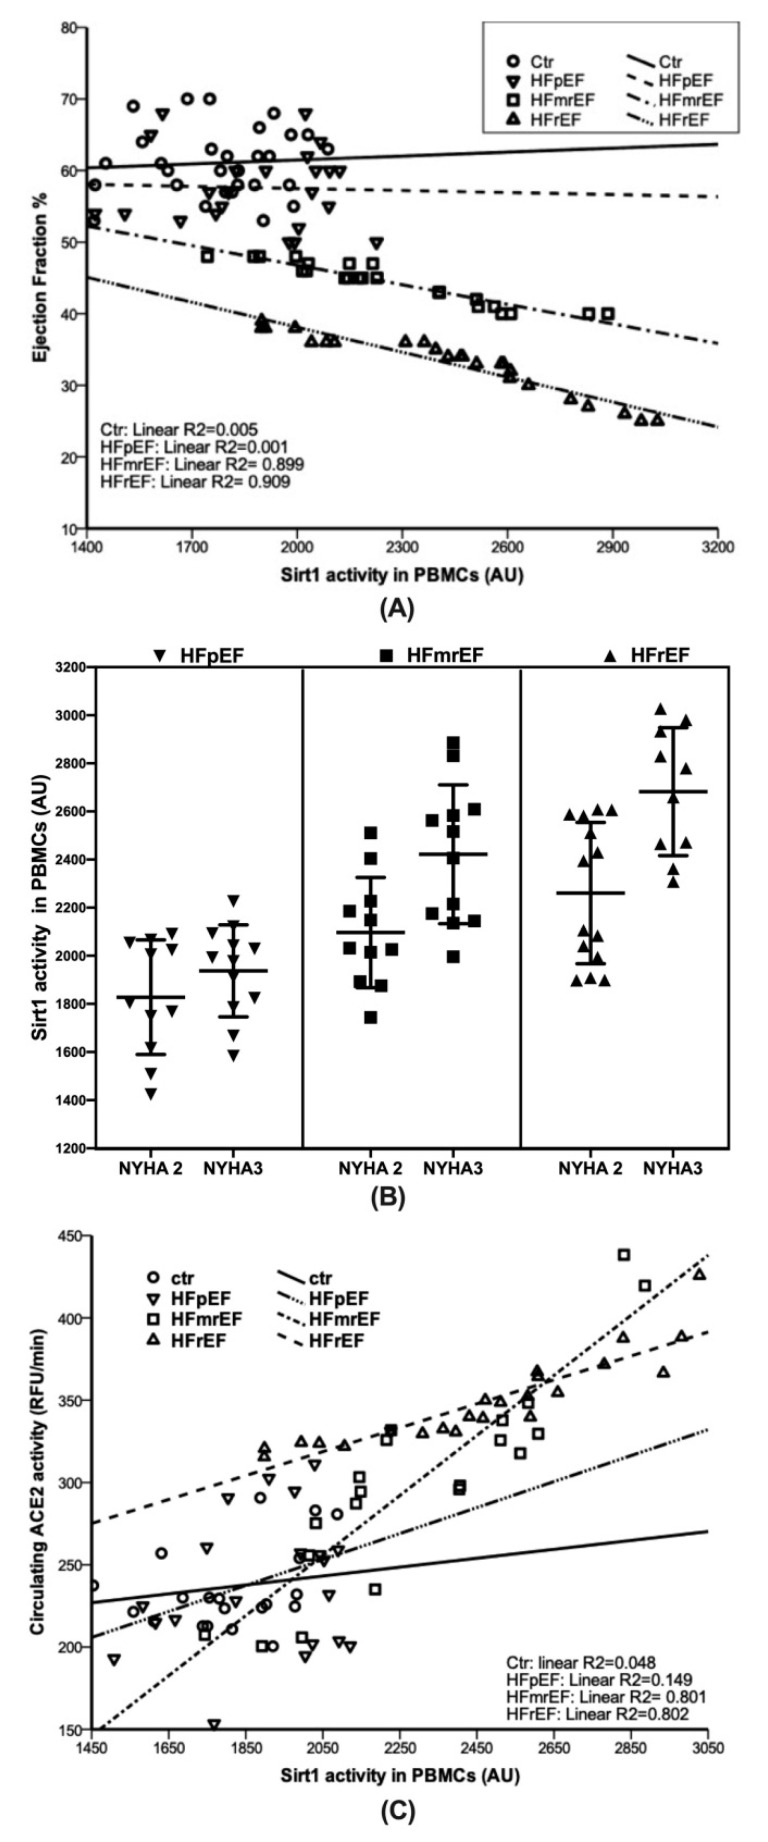
Figure 2.
(A) Correlation between EF and Sirt 1 activity stratified by HF groups and no HF controls (Ctr). In the HFmrEF and HFrEF groups a very strong correlation was found between Sirt 1 activity levels and EF values (r2 = 0.899 and r2 = 0.909, respectively). Otherwise, in the HFpEF as in the no HF controls no correlation was found. (B) Association between NYHA classes and Sirt 1 activity stratified by HF groups. Sirt 1 activity represented the best predictor of NYHA classes in the HFrEF (p = 0.018, β = 1.006; 95%CI 1.001 1.010) and HFmrEF (p = 0.024; β = 1.005; 95%CI 1.001 1.009) but not in the HFpEF. (C) Correlation between ACE2 and Sirt 1 activities stratified by HF groups and no HF controls (Ctr). In the HFmrEF and HFrEF groups a very strong correlation was found between Sirt 1 activity and ACE2 activity levels (r2 = 0.801 and r2 = 0.802, respectively). Otherwise, in the HFpEF as in the no HF controls no correlation was found.

