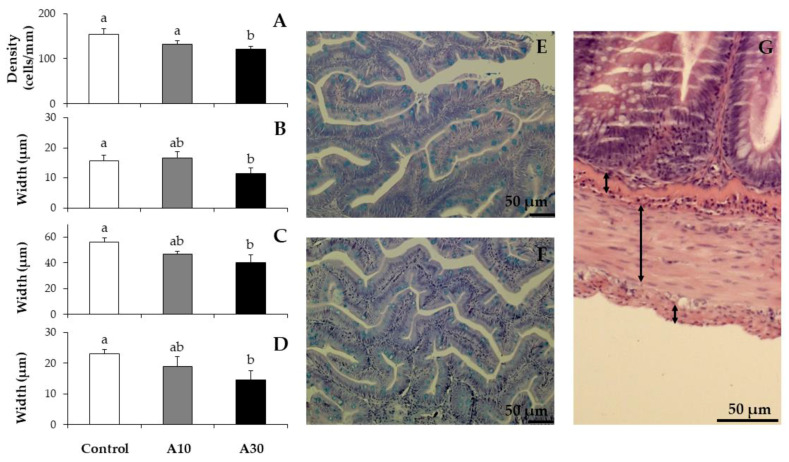
Figure 2.
Histopathology analysis of proximal intestine showing goblet cell’s density (A), width of submucosa (B), muscular (C) and serosa (D) layers in rainbow trouts fed experimental diets containing increasing levels of Narbonne vetch meal: 0% (Control), 10% (A10) and 30% (A30) of inclusion. Please, note examples of proximal intestine sections with high (Control; (E)) and low (A30; (F)) density of goblet cells, and an example of measured width of submucosa, muscular and serosa layers (G). Different letters denote significant differences among experimental groups at each sampling day (ANOVA, p < 0.05; n = 3).

