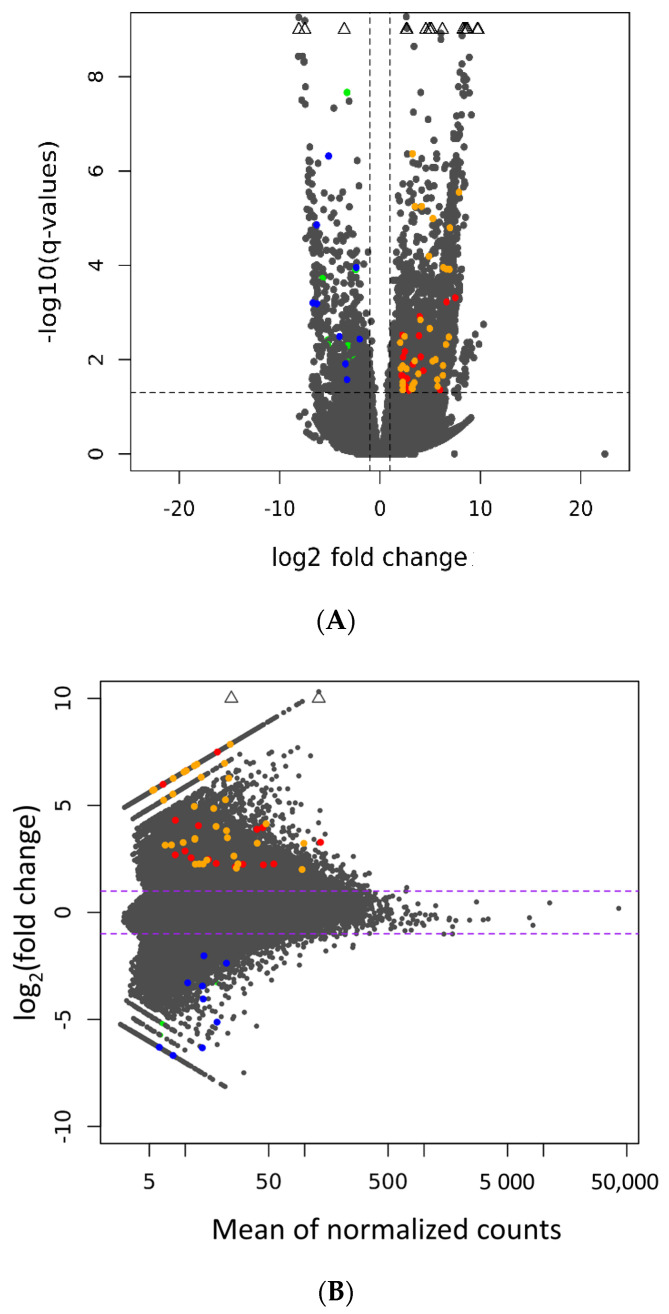
Figure 6.
Visualization of differentially expressed long non-coding RNAs (DElncRNAs) and their potential regulatory target genes (A) Volcano plot. The volcano plot represents the logarithmic (−log10) scale of the adjusted p-values shown in the Y axis and the logarithmic (log2) scale of the fold change shown in the X axis. (B) MA plot. The MA plot represents the logarithmic scale of the fold change shown in the Y axis and the normalized expression count values shown in the X axis. Orange and blue dots represent upregulated and downregulated DElncRNA, respectively. Red and green dots represent upregulated and downregulated target genes, respectively. The expression that is not within the scale plot is indicated in a diamonds symbol.

