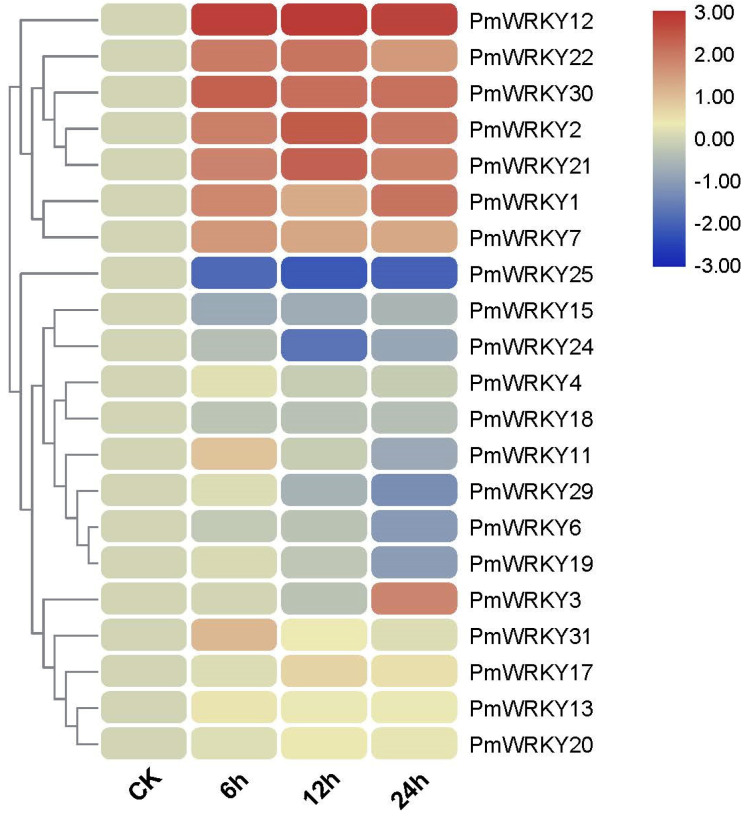
Figure 5.
Transcriptional profiles of WRKY family members in P. massoniana under elevated CO2 stress, which includes four sets of data: 0 h(CK), 6 h, 12 h and 24 h after treatment. The relative expression of CK was set as "1". The color scale represents relative expression levels based on the values of log2 fold change scale.

