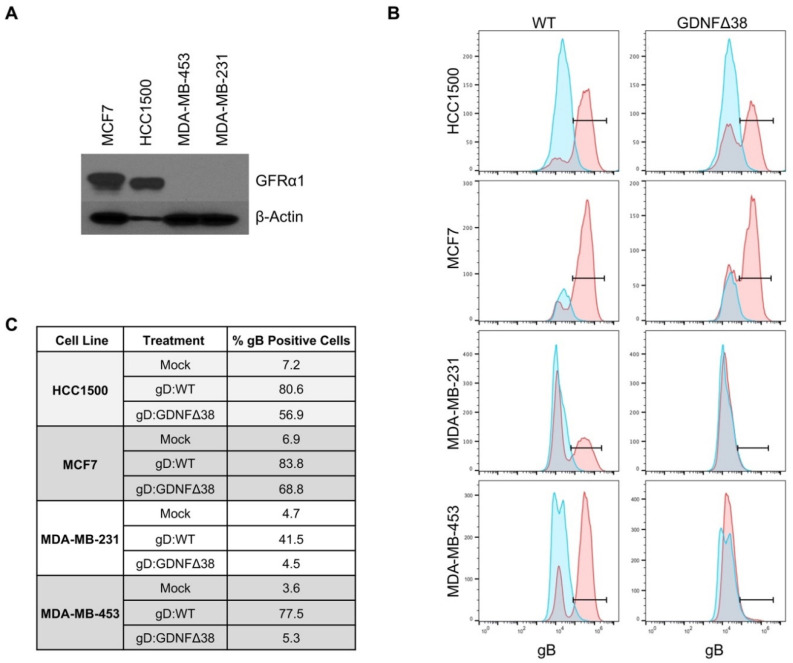
Figure 4.
Virus infection of breast cancer cell lines. (A) MCF7, HCC1500, MDA-MB-231, and MDA-MB-453 cell lines were assessed for GFRα1 expression by Western blot analysis of whole cell lysates; β-actin detection was used as a loading control. (B) HCC1500, MCF7, MDA-MB-231, and MDA-MB-453 cells were infected with KNTc-gD:GDNFΔ38 or KNTc-gD:wt virus at 3 pfu/cell and flow cytometry for gB protein on the cell surface was performed at 24 hpi. For each cell line, uninfected cells are shown in blue compared to virus infected cells in red; KNTc-gD:wt infected cells (WT) and KNTc-gD:GDNFΔ38 infected cells (GDNFΔ38). (C) Quantification of gB+ cell populations as a percent of the total analyzed cells for each treatment group.

