Figure 2.
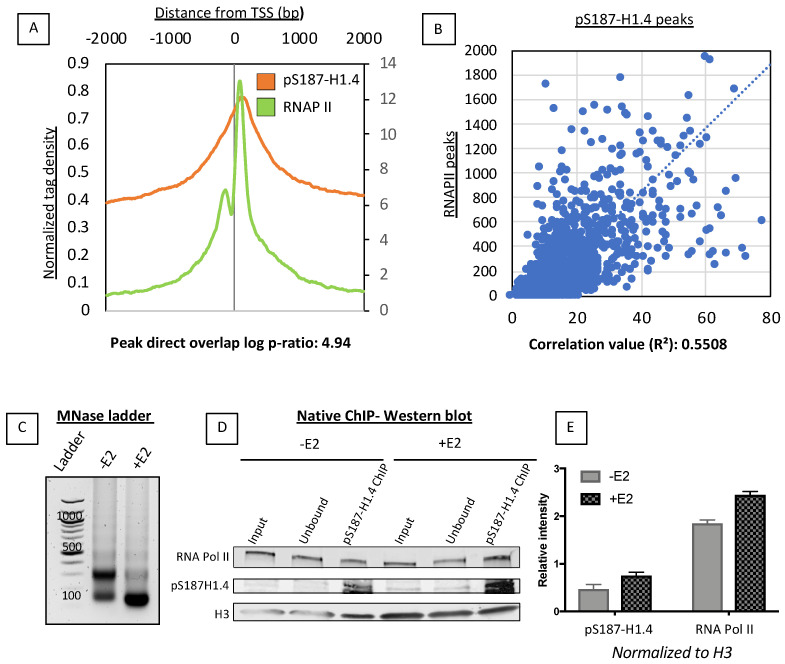
pS187-H1.4 associates with RNAPII. (A) Aggregate plot comparing average RNAPII (Green) and p187-H1.4 (Orange) peaks near promoter regions. The signal was aligned +2 Kb and −2 Kb relative to the Refseq TSSs. RNAPII plotted on a secondary axis (label on right side of graph). Direct overlap ratio calculated as log ratio: 4.94. (B) Correlation scatter plot of pS187-H1.4 and RNAPII peak overlap throughout the genome. The correlation co-efficient R2 calculated at 0.558. (C) The 6 min MNase digested DNA from estradiol untreated (−E2) and estradiol treated (+E2) MCF7 nuclei run on a 1.8% agarose gel. (D) Western blot following pS187-H1.4 native-ChIP. RNA pol II, pS187- H1.4 antibodies used for detection and H3 used as a loading control. (E) Relative intensity quantification of western blot in Figure 2D. H3 signal was used to normalize pS187-H1.4 and RNAP II signals.

