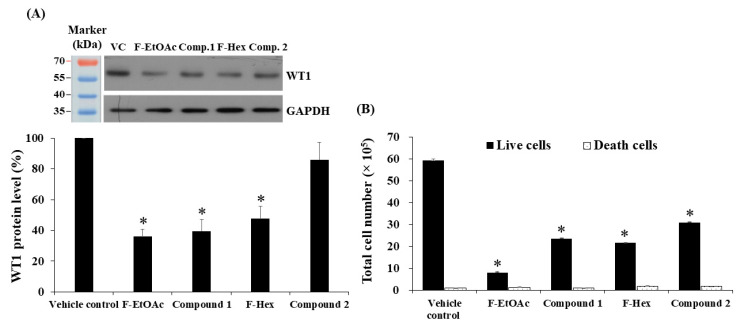
Figure 8.
Effect of F-EtOAc, compound 1, F-Hex, and compound 2 on KG-1a cells. (A) The level of WT1 protein following treatment F-EtOAc (4.58 μg/mL), compound 1 (comp. 1; 2.30 μg/mL), F-Hex (26.29 μg/mL), or compound 2 (comp. 2; 29.90 μg/mL) for 48 h. Protein levels were evaluated using Western blotting and analysed using scan densitometer. The levels of WT1 were normalised using glyceraldehyde phosphate dehydrogenase (GAPDH) protein levels. (B) Total cell number after treatment with F-EtOAc, compound 1, F-Hex, and compound 2 for 48 h was determined via the trypan blue exclusion method. Each bar represented mean ± SD of three independent experiments performed in triplicate. Asterisks (*) denote significant differences between C. comosa extracts and vehicle control (* p < 0.05).

