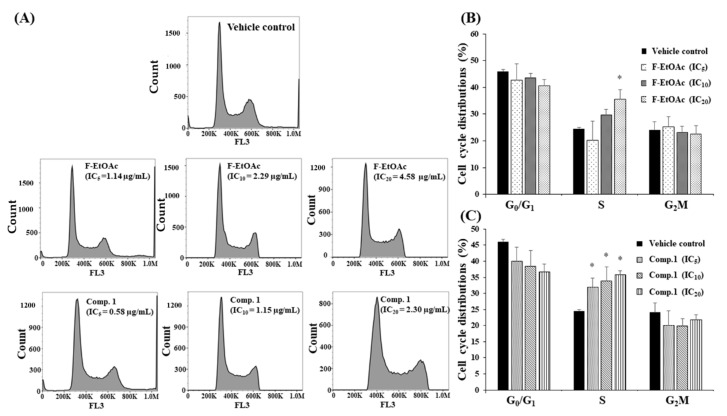
Figure 11.
Cell cycle arrested following F-EtOAc and compound 1 treatments for 48 h. (A) KG-1a cells at the density of 1.5 × 10⁵ cells/mL treated with F-EtOAc or compound 1 at various inhibition concentrations (IC) from IC5 to IC20, and DMSO as vehicle control for 48 h. Cell cycle was analysed using flow cytometry. (B) Cell cycle distribution post F-EtOAc treatments. (C) Cell cycle distribution post compound 1 treatments. Data are expressed as mean ± SD of three independent experiments. Asterisks (*) denote significant differences from the vehicle control (* p < 0.05).

