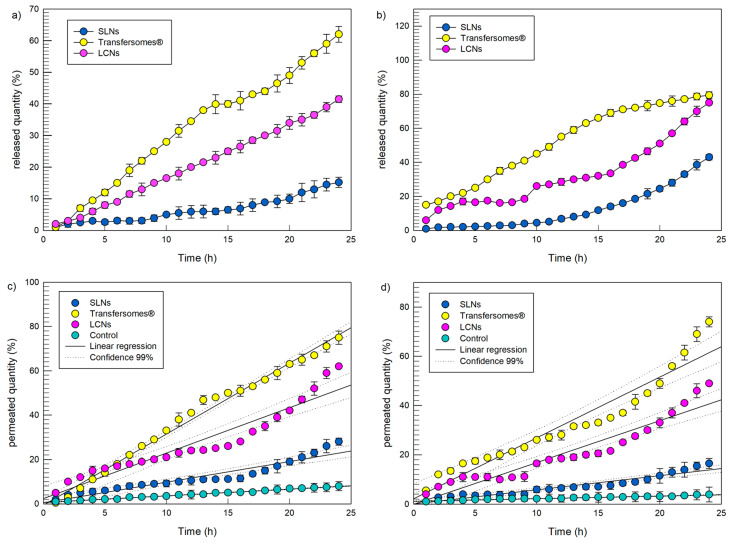
Figure 3.
Release profiles (panel (a,b)) and percutaneous permeations (panels (c,d)) through SCE-membranes of the hydrophilic probe fluorescein (panels (a,c)) and the hydrophobic probe red oil O (panels (b,d)) by SLN, transfersomes® and LCNs. Six different experiments were carried out and the results are expressed as the mean value ± standard deviation. If not visible, standard deviation bars are within the symbol.

