Figure 1.
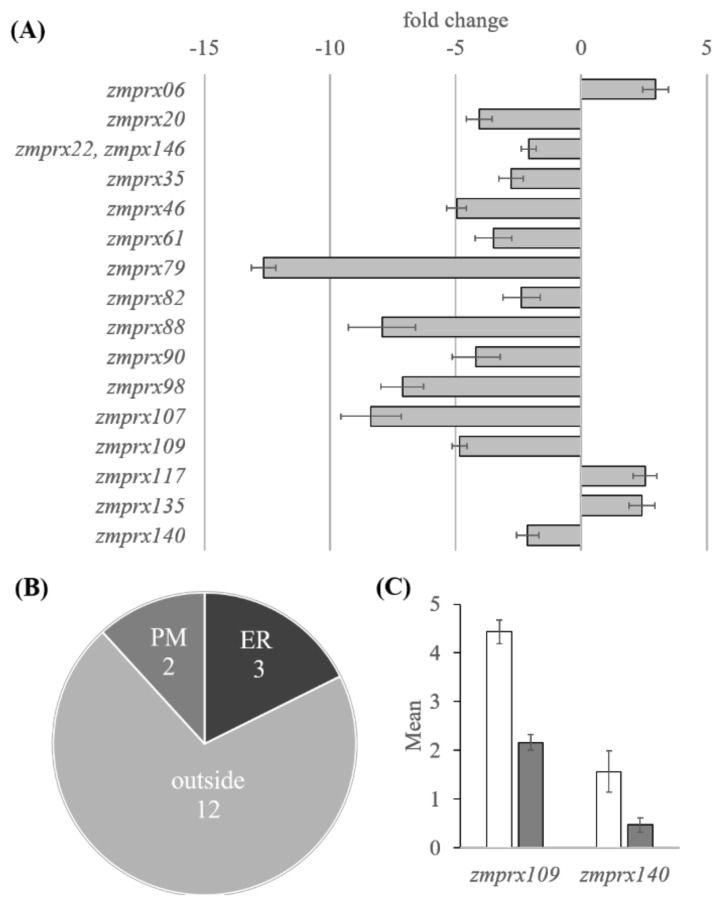
Differential regulation and putative localization of class III peroxidases under hypoxia. From three non-stressed and 24 h hypoxia-stressed root samples, expression profiles were calculated as Fragments Per Kilobase Million (FPKMs). Differentially expressed gene (DEG) results were performed on a comparison pair (stressed versus controls), using FPKM with a fold change >2 and Student’s t-test p < 0.05. (A) Differential expressed peroxidases (excluding pseudogenes) with their fold change expression and (B) their predicted localization, using PSORT (http://psort1.hgc.jp/form.html) at either the plasma membrane (PM), the endoplasmic reticulum (ER) or “outside” (apoplast, cell wall). (C) Gene expression (mean = mean of normalized signal for each sample or group) of the two putative plasma membrane-bound class III peroxidases that were differentially expressed in controls (white columns) and hypoxia-stressed samples (gray columns). Error bars indicate standard deviation (three biological replicates).

