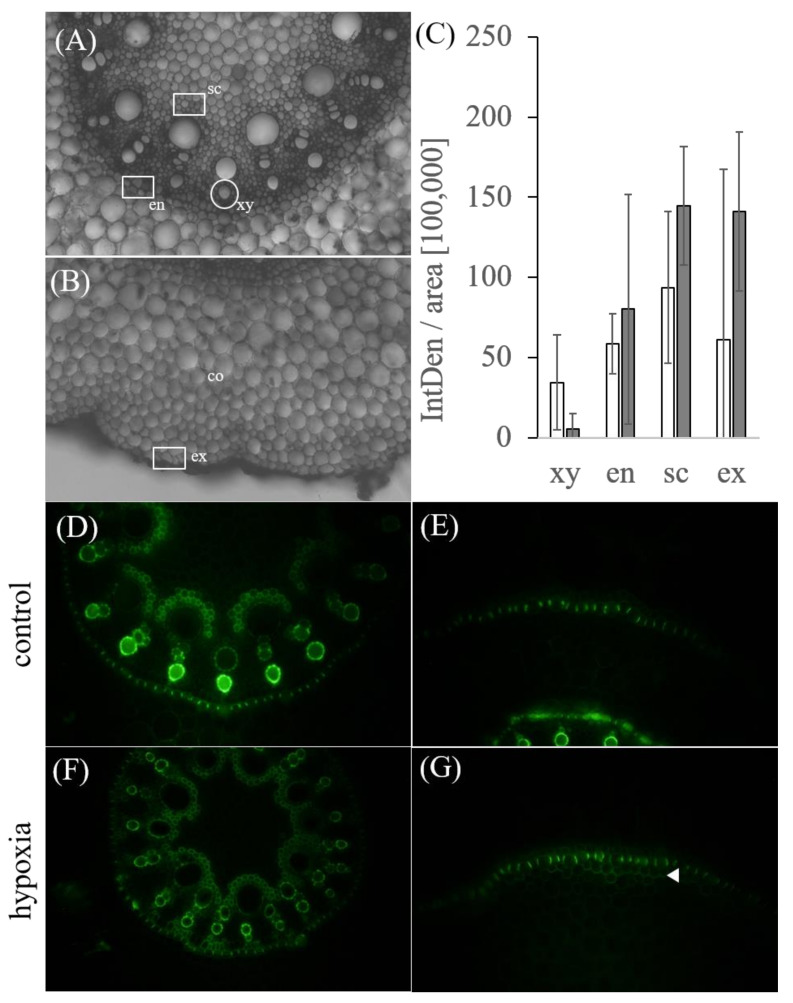
Figure 8.
Visualization of suberin in the mature zone of primary root cross-sections from control and hypoxia-stressed maize plants. Control and 24 h hypoxia-stressed maize roots were cross-sectioned by hand and stained with the fluorescent berberine–aniline blue to detect suberin. Images were taken with 10x magnification using an Olympus BHS fluorescent microscope. (A,D,F) Shown is an overview of the central cylinder with vascular bundles and (B,E,F) the cortex and exodermis of maize root transversal section in brightfield image (A,B) and fluorescent image (D–G). (G) White arrow indicates an additional suberin layer beneath the exodermis in stressed samples. (C) Intensity measurements of endodermis (en), exodermis (ex), vascular sclerenchyma cells (sc) and xylem vessels (xy) were calculated as intensity per area (IntDen/area) for controls (white columns) and stressed samples (grey columns). Error bars indicate standard deviation for three to five biological replicates.

