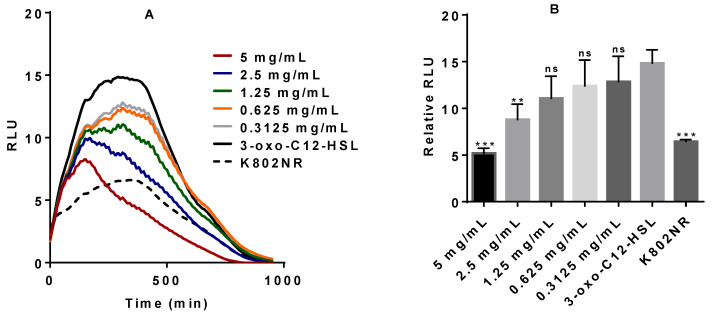
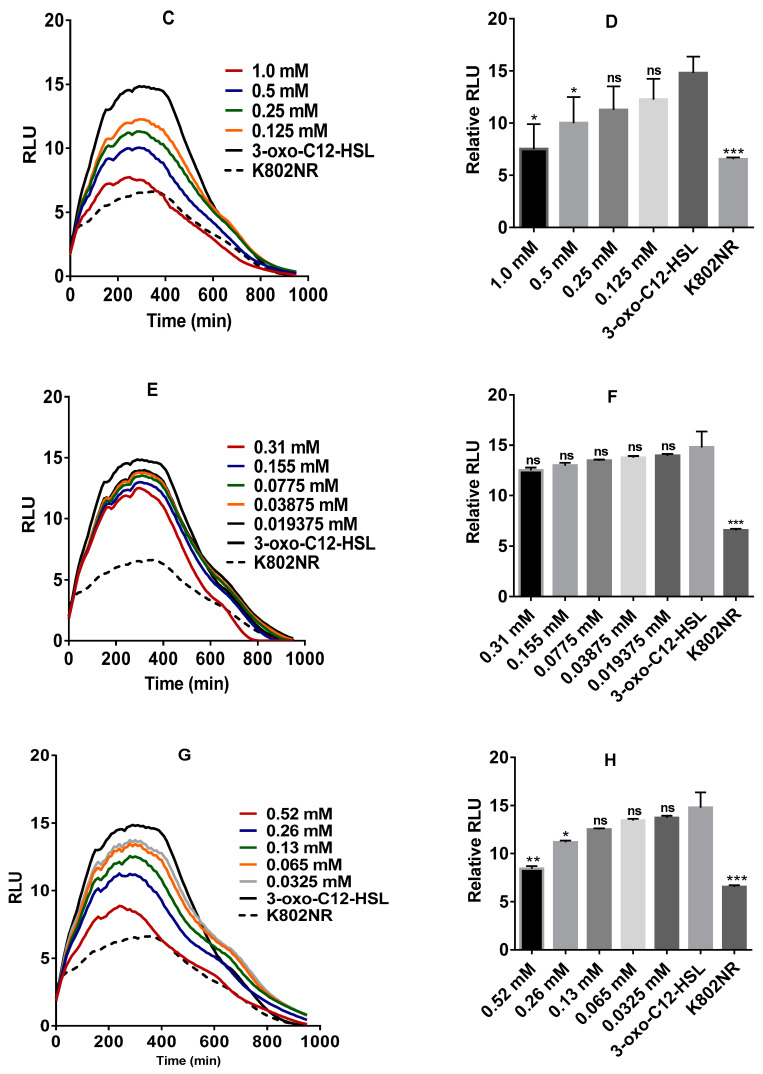
Figure 3.
The bioluminescent response of K802NR reporter strain in the presence of pure stevia-derived components. (A) Stevia extract; (B) stevia extract relative to the control, corresponding to the data in panel A; (C) stevioside; (D) stevioside relative to the control, corresponding to the data in panel C; (E) Reb A; (F) Reb A relative to the control, corresponding to the data in panel E (G); steviol; (H) steviol relative to control, corresponding to the data in panel G. Error bars are not shown in A, C, E, and G to ensure clarity of figures. The final concentration of 3-oxo-C12-HSL was 5 × 10⁻¹⁰ M. All presented concentrations are the final concentrations. The amount of luminescence is expressed in relative light units or RLUs. * p < 0.05, ** p < 0.01, *** p < 0.001, and ns not significant. Values represent mean ± SD, n = 3 (three different experimental readings).


