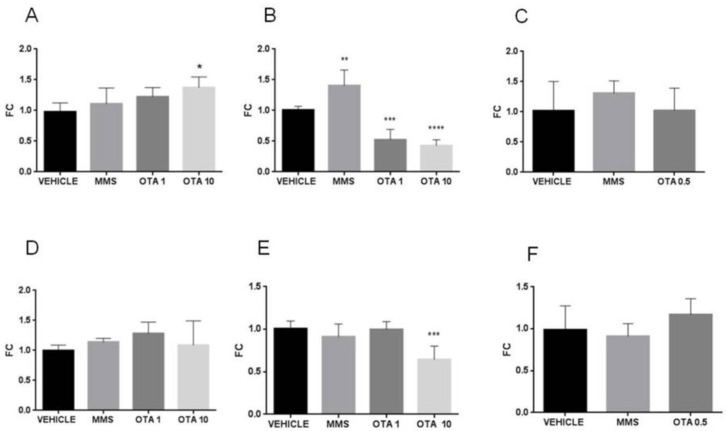
Figure 15.
Effect of OTA expositions on the Sod1 and Sod2 mRNA expression levels in the kidney. A: Sod1 gene mRNA expressions of the single oral dose (24 h) OTA-treated kidney samples. The high OTA dose significantly increased the Sod1 mRNA level (p < 0.05). B: Sod1 gene expression levels of the repeated daily oral dose (72 h) OTA-treated kidney samples. Both OTA administration significantly decreased the Sod1 mRNA level (p < 0.001 and 0.0001, respectively). C: Sod1 gene expression alterations of the repeated daily oral dose (21 days) OTA-treated kidney samples. The OTA treatment did not significantly influence the Sod1 mRNA level. D: Sod2 gene mRNA expressions of the single oral dose (24 h) OTA-treated kidney samples. The OTA treatment did not significantly influence the Sod2 mRNA level. E: Sod2 gene expression levels of the repeated daily oral dose (72 h) OTA-treated kidney samples. The high OTA dose treatment significantly decreased the Sod2 mRNA level (p < 0.001), F: Sod2 gene expression alterations of the repeated daily oral dose (21 days) OTA-treated kidney samples. The OTA treatment did not significantly influence the Sod2 mRNA level. Abbreviations: MMS: methyl-methanesulfonate-treated group; OTA 1 and OTA 10: 1 and 10 mg/kg bw ochratoxin-A-treated groups in the single oral dose (24 h) and repeated daily oral dose (72 h) experiment; OTA 0.5: 0.5 mg/kg bw ochratoxin-A-treated group in the repeated daily oral dose (21 days) experiment. Mean ± S.D. Data were analyzed by one-way ANOVA and Tukey’s post hoc test * p < 0.05, ** p < 0.01, *** p < 0.001, **** p < 0.0001 vs. vehicle.

