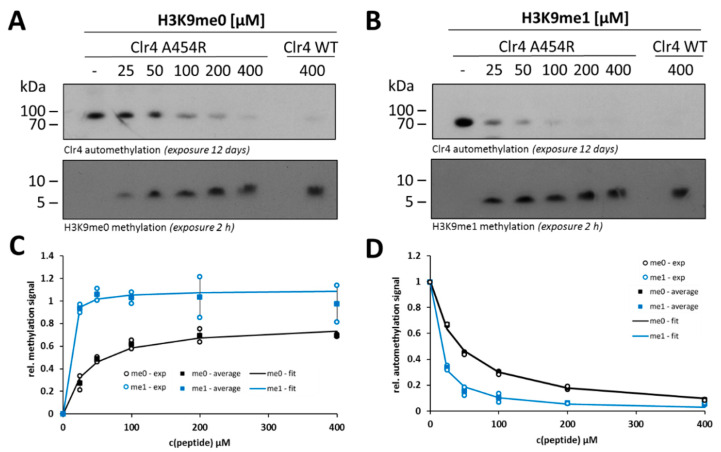
Figure 5.
Methyltransferase activity and automethylation level of Clr4 A454R at different concentrations of H3K9me0 and H3K9me1 histone peptides. Autoradiography of the in vitro methyltransferase assay of A454R using 25–400 µM H3K9me0 (A) or H3K9me1 (B) as substrate. A reaction of WT enzyme incubated with 400 µM peptide was loaded on each gel as reference for the quantitative analysis. (C) Michaelis–Menten model fit of the data for the histone peptide methylation activity observed in two independent repeats of the experiments shown in panels (A,B). All values are represented relative to the WT enzyme activity at 400 µM H3K9me1 peptide. (D) Analysis of the inhibition of A454R automethylation by H3K9me0 and H3K9me1 peptides detected in two independent repeats of the experiments shown in panels (A,B). Data were fitted to an inhibition model and are represented relative to Clr4 enzyme automethylation in the absence of peptide. In panels (C,D), averages are shown as squares, error bars represent the SEM and individual data points are shown as circles. The kinetic parameters and inhibition constants are listed in Table 1.

