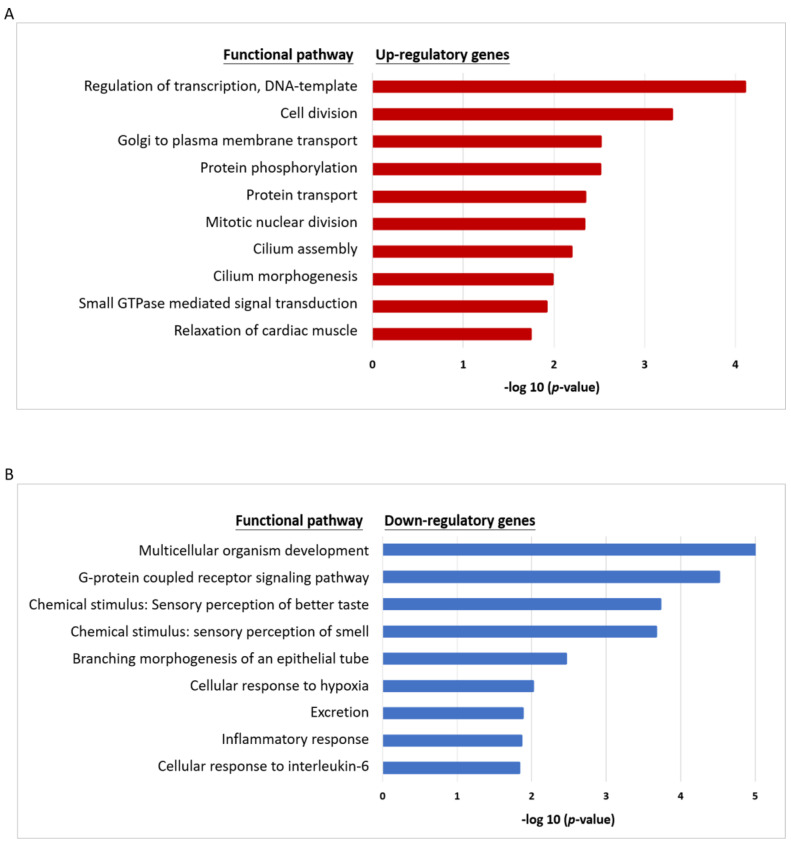
Figure 3.
Bioinformatic analysis of the functional pathways associated with CR in HNC cells. (A) A list of the top 10 significant molecular functional pathways determined by the Database for Annotation, Visualization, and Integrated Discovery (DAVID) enrichment analysis of the 345 up-regulatory genes. (B) A list of the top 10 significant molecular functional pathways determined by DAVID enrichment analysis of the 305 down-regulatory genes. Bar chart representing the classification of Gene Ontology (GO) terms corresponding to biological processes (GOTERM_RP_ DIRECT). The enriched significance (p ≤ 0.05) values were negative base-10 log-transformed.

