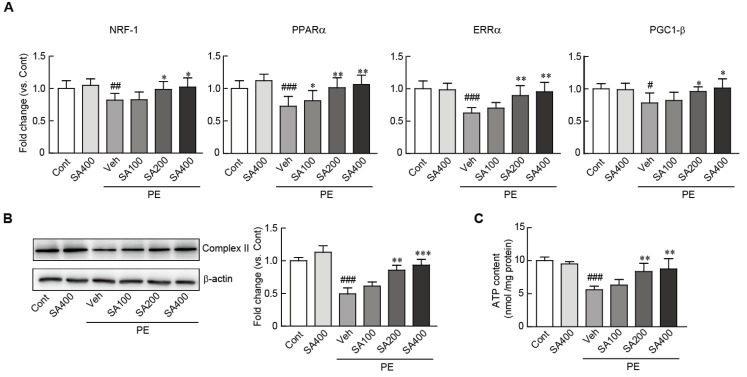
Figure 4.
SA preserves mitochondrial integrity in PE-induced hypertrophic cardiomyocytes. (A) qRT-PCR analysis of mitochondrial biogenesis-related genes (NRF, PPARα, ERRα, and PGC1-β). (B) The expression level of complex II, a mitochondrial structure-related protein, was measured by Western blot analysis. The band densities were measured by using NIH ImageJ software. β-actin was used as a loading control. The analyses were performed in triplicate, using three independent samples. (C) ATP levels were luminometrically measured in SA-pretreated cardiomyocytes treated with PE. Data are expressed as the mean ± standard error of the mean (SEM). Significance was assessed by one-way analysis of variance (ANOVA) with a Bonferroni post hoc test. # P < 0.05, ## P < 0.01, and ### P < 0.001 vs. the control group; * P < 0.05 and ** P < 0.01, and *** P < 0.001 vs. the PE-only treated group. Veh, vehicle-treated; SA100, SA200, and SA400, 100, 200, and 400 μM SA-treated groups, respectively; PE, phenylephrine; Cont, control; SA, sinapic acid.

