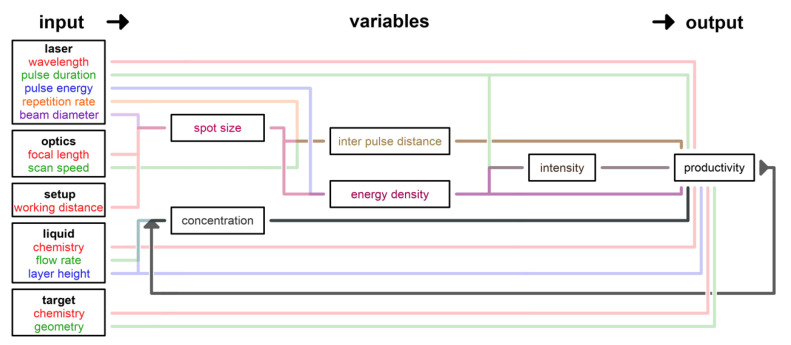
Figure 5.
Dependence graph of process parameters, arranged in component clusters, relevant to LAL up-scaling. If not marked differently by an arrow, the flow goes from the left to the right in horizontal direction and from the outside to the inside in vertical direction. Colors were used only for an improved overview. Reprinted with permission from [66].

