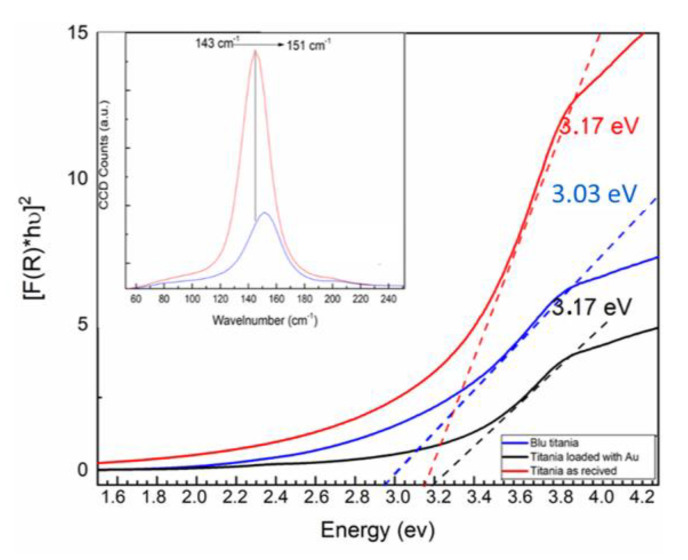
Figure 20.
Energy bandgap calculation by Kubelka-Munka transformation for the three catalyst. Inset: a zoom of the lower energy region was set up the Au NPs adsorption (right side). In the inset is reported the micro-Raman spectra of as prepared TiO2 (red line) and of blue Titania (blue line) with a zoom of the TiO2 Eg anatase peaks before and after the laser treatment.

