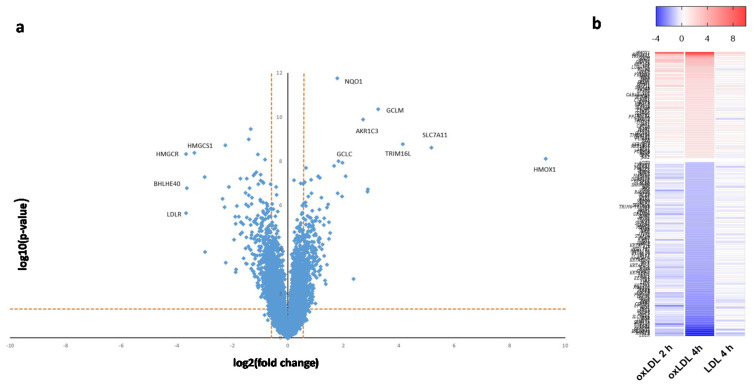
Figure 2.
Analysis of differential gene expression in ARPE-19 cells following OxLDL or LDL treatment. (a) Scatter plot of the mean expression fold change versus significance following 4-h treatment with OxLDL. The horizontal dashed line represents the threshold limits for statistical significance (q = 0.05); the vertical dashed lines represent fold change threshold limits (≥ ±1.5). Down-regulated genes are on the left; up-regulated genes are on the right. Genes with the highest magnitude of expression change are labeled (see text and Table 1 for details). (b) Heat map showing time-dependent gene expression patterns following treatment with OxLDL (2 and 4 h) or LDL (4 h). Results for a subset of high-significance genes are shown. Red color represents up-regulation and blue color represents down-regulation. Intensities of the bars indicate the degree of expression change.

