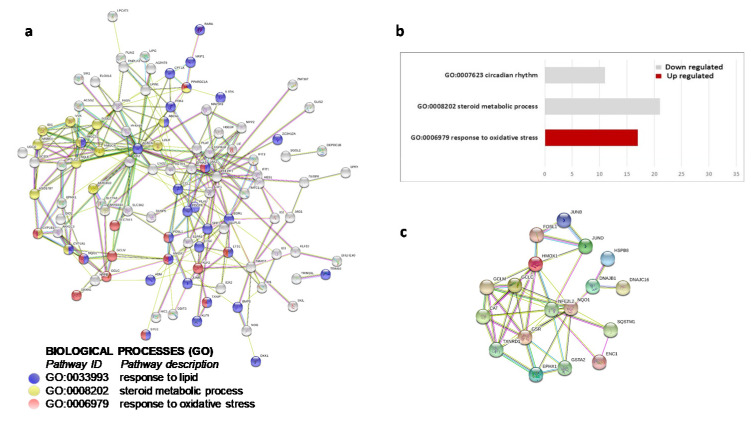
Figure 3.
Functional analysis for differentially expressed genes after 4-h OxLDL treatment. Selected functional clustering results by DAVID and STRING. (a) Selected functional clustering results by DAVID. Gray bars: biological processes down-regulated by OxLDL; red bars: processes up-regulated by OxLDL. Molecular networks and pathways. (b) STRING gene interaction network. Selected, significantly enriched biological processes are highlighted with colored circles. (c) STRING gene interaction network encompassing members of NRF2-controlled oxidative stress response.

