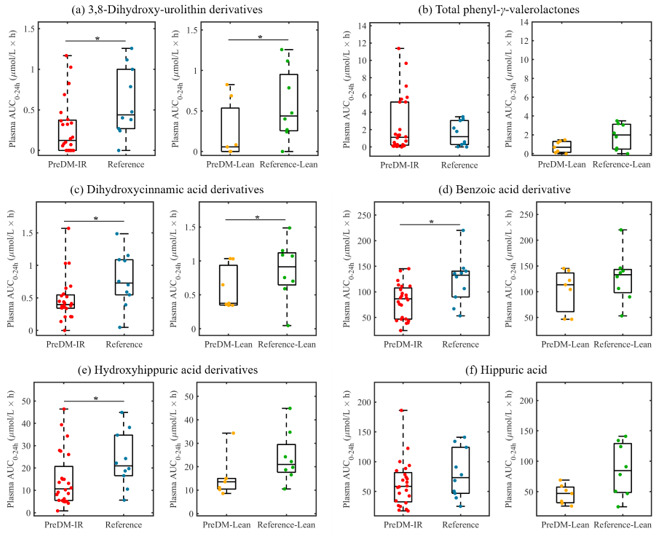
Figure 5.

Box plots showing AUC0–24 h (areas under the 24 h curve) of microbial (poly)phenolic metabolites in plasma post-consumption of the red raspberry test (RRBtest) drink in PreDM-IR (red dots) vs. Reference (blue dots) and PreDM-Lean (yellow dots) vs. Reference-Lean (green dots): (a) 3,8-dihydroxy-urolithin derivatives; (b) total phenyl-γ-valerolactones; (c) dihydroxycinnamic acids derivatives; (d) benzoic acids derivatives; (e) hydroxyhippuric acids derivatives; (f) hippuric acid. * Significantly different, p < 0.05.
