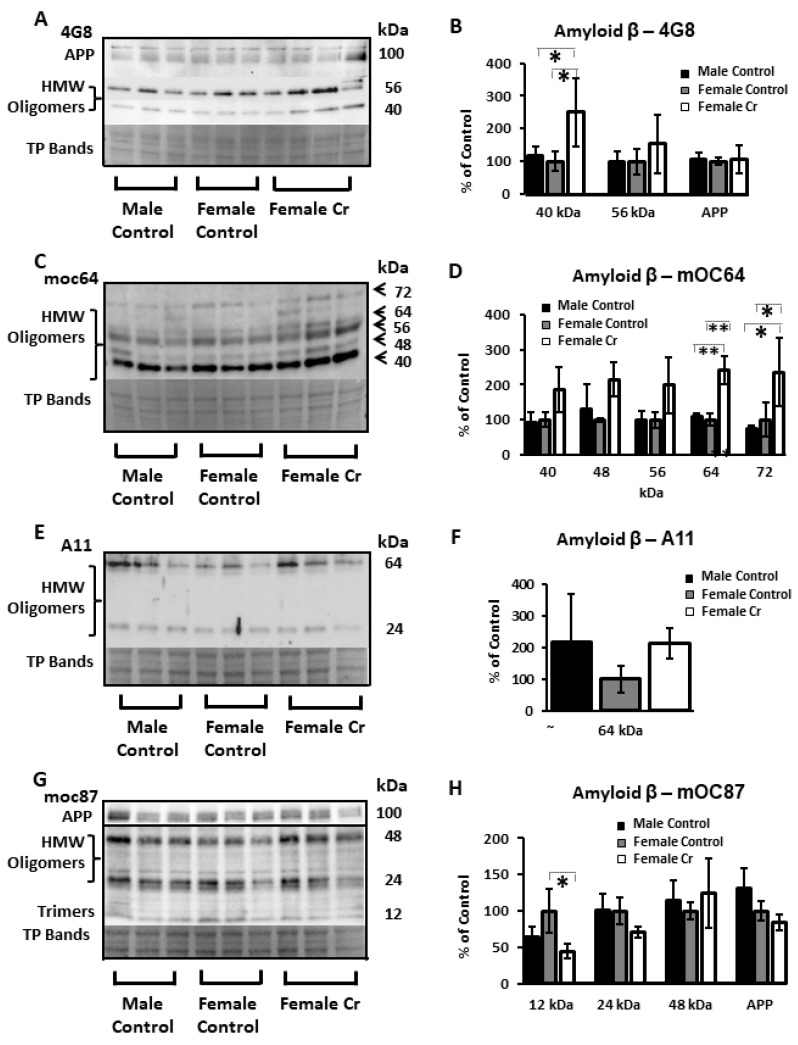
Figure 10.
Relative hippocampal levels of amyloid β (Aβ) and amyloid precursor protein (APP) in control and Cr-supplemented 3xTg mice. Representative Western blots detecting Aβ (and APP in some cases) with the antibodies (A) 4G8, (C) moc64, (E) A11, and (G) moc87. Total protein (TP) was measured with Ponceau S staining (representative bands shown to indicate sample loading). Bar graphs (B,D,F,H) depict densitometry values after normalization to total protein bands and expressed as the percentage change from female control-fed means (100%) ± SD. ANOVA or Kruskal–Wallis; n = 3–4. * p < 0.05; ** p < 0.01.

