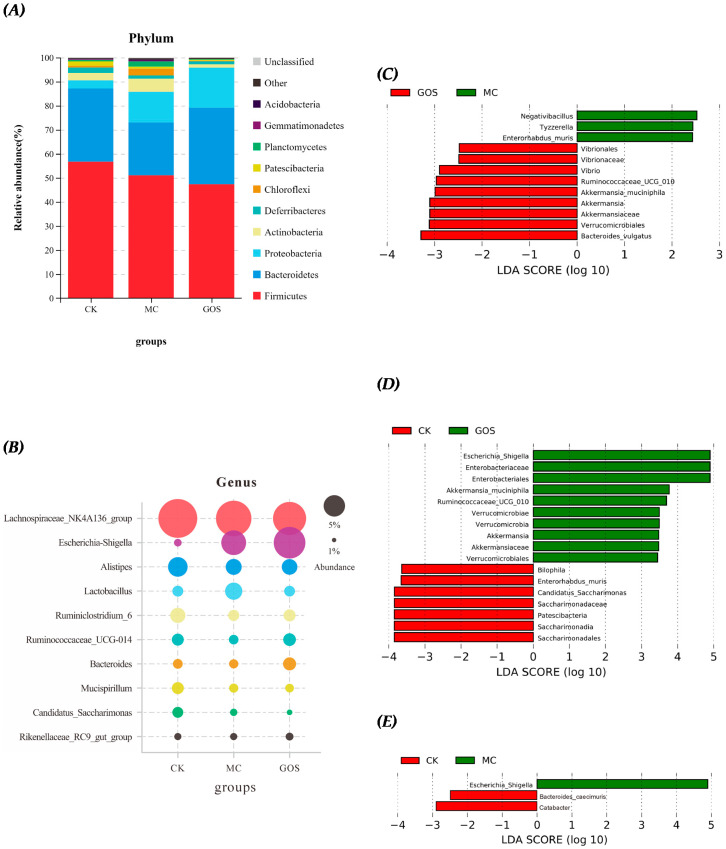
Figure 7.
Relative abundance and Linear Discriminant Analysis (LDA) of intestinal flora in different groups of mice. (A) Relative abundance of phylum level; (B) Relative abundance of genus level; (C) LDA in MC group and galactooligosaccharide (GOS) group; (D) LDA in blank control (CK) group and GOS group; (E) LDA in model control (MC) group and CK group.

