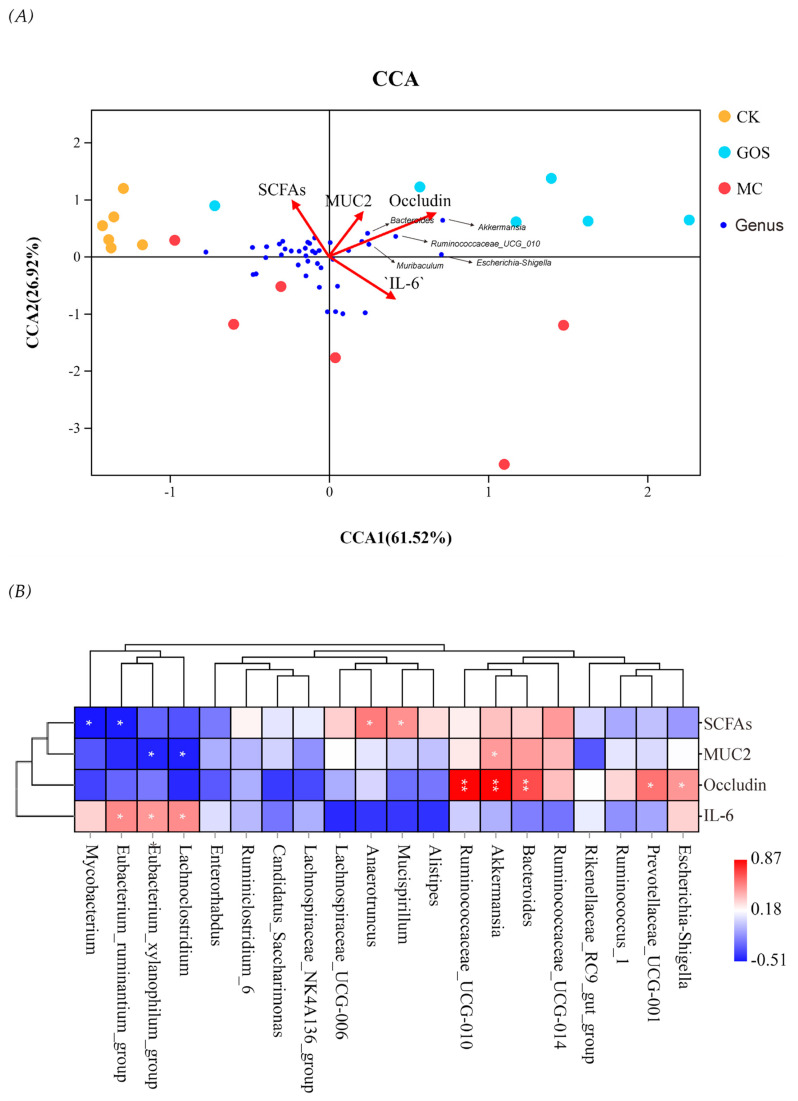
Figure 9.
Correlation analysis of environmental factors. (A) Canonical correspondence analysis (CCA) of microbial population distribution and environmental factors. Environmental factors are marked by red arrows. The angle between the arrow lines and the sorting axis indicates the correlation between environmental factors and the sorting axis. Environmental factors with longer arrow line had a higher correlation with the distribution of intestinal flora. (B) As shown in the Spearman correlation thermogram, there were significant differences in bacteria abundance between different environmental factors. The colors range from blue (negative correlation) to red (positive correlation). The significant correlation was expressed by * p < 0.05 and ** p < 0.01.

