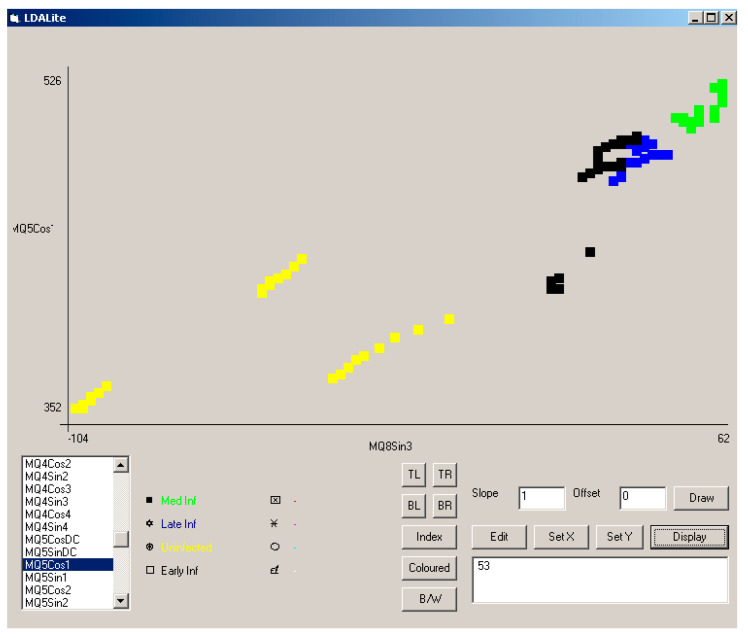
Figure 12.
Separation of sample type using MQ5 Cos1 and MQ8 Sin3 across all three experiments. Responses from uninfected (HS) samples are plotted in yellow, from early infection (ES) in black, from moderate infection (MS) in green, and from late infection (LS) in blue. The use of other coefficients can be used to distinguish fresh air, etc.

