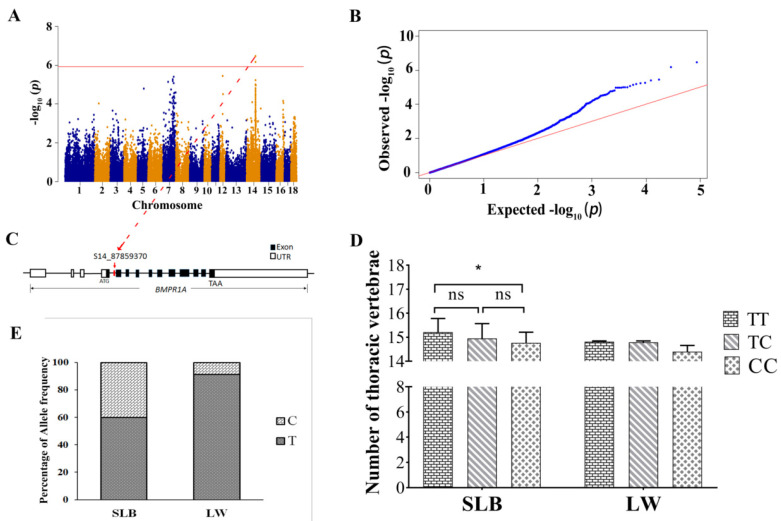
Figure 3.
Identification of BMPR1A using conditional GWAS of the NTV. (A) Manhattan plot displaying the GWAS results of the NTV. The red horizontal line indicated the Bonferroni significance threshold (1.10 × 10⁻⁶). Dots represent SNPs and the S14_87859370 is highlighted at the top dot. (B) The Q-Q plots obtained from the conditional GWAS for the NTV. (C) Red arrow represents the most significant SNP signal of the NTV. The S14_87859370 in the intron 4 of BMPR1A is marked in red. (D) The difference analysis among three genotypes of S14_87859370 for NTV in Songliao Black (SLB) and Large White (LW) pig populations. * indicates p < 0.05. (E) Allele frequencies of S14_87859370 in SLB and LW pig populations.

