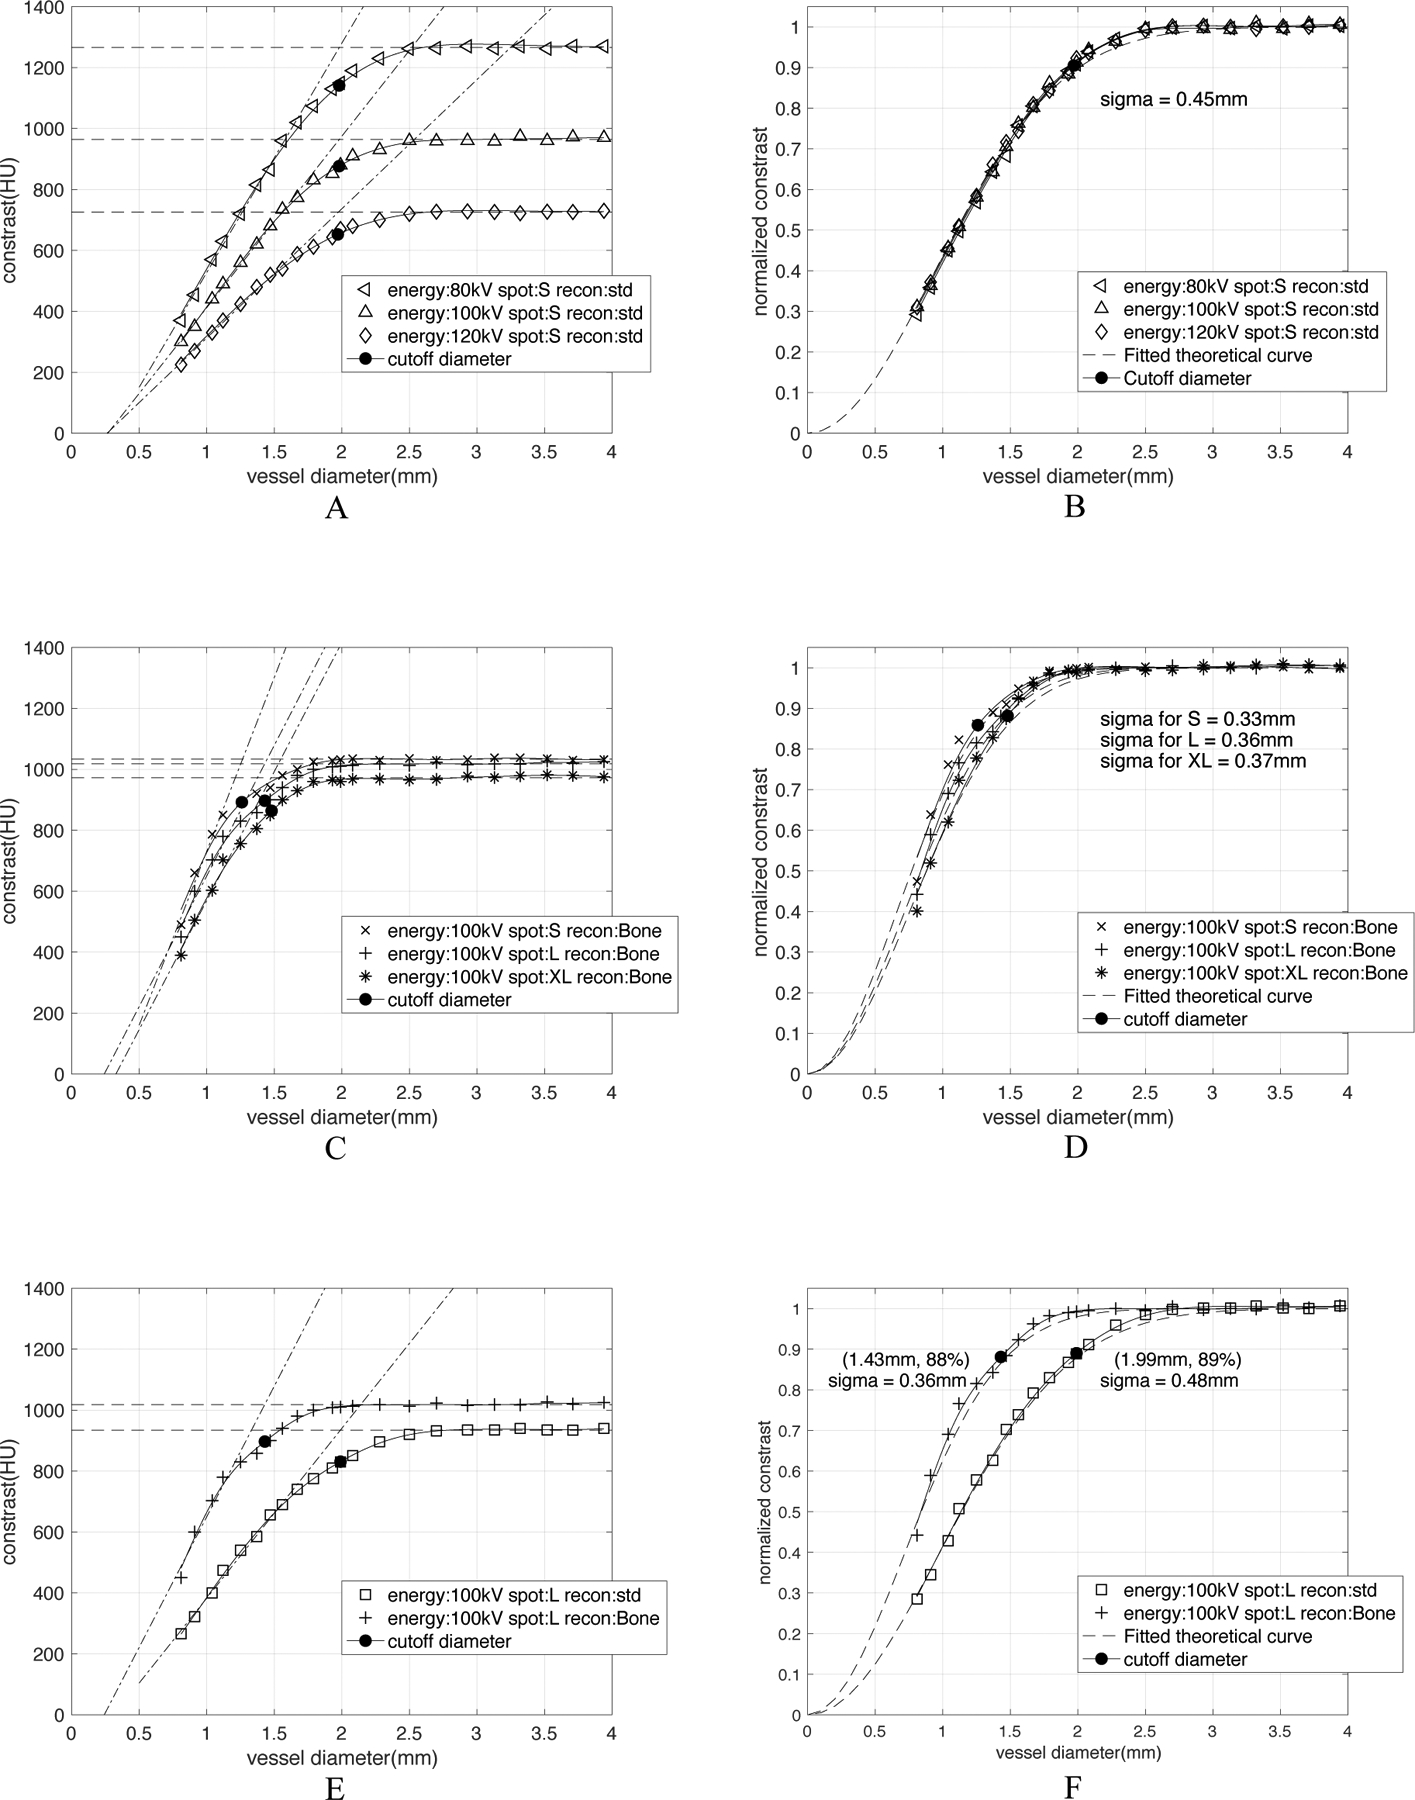
Figure 6:

CT number calibration curve is CT-acquisition-parameter-dependent. All characterized σ were calculated by Equation 3(D50 = 2.355 σ), where D50 is the vessel diameter that has a 50% drop of constant amplitude in the curve. A) shows the influence of x-ray tube current energies on the raw calibration curves. (B) After normalization to the constant amplitude in large vessels, the three curves essentially become equivalent with a characteristic width of σ = 0.45mm. (C) and (D) show the difference between curves for different focal spot sizes exist both before and after the normalization. The calibration of small, large and extra-large focal spot size can be characterized with σ = 0.33, 0.36, 0.37mm respectively. (E) and (F) show the effect of reconstruction kernels both before and after the normalization. The high-resolution Bone kernel has σ = 0.36mm, a cutoff diameter as 1.43mm and cutoff contrast as 88% of the constant amplitude; while the low-resolution standard kernel has σ = 0.48mm, a cutoff diameter as 1.99mm and cutoff contrast of 89% of the constant amplitude.
