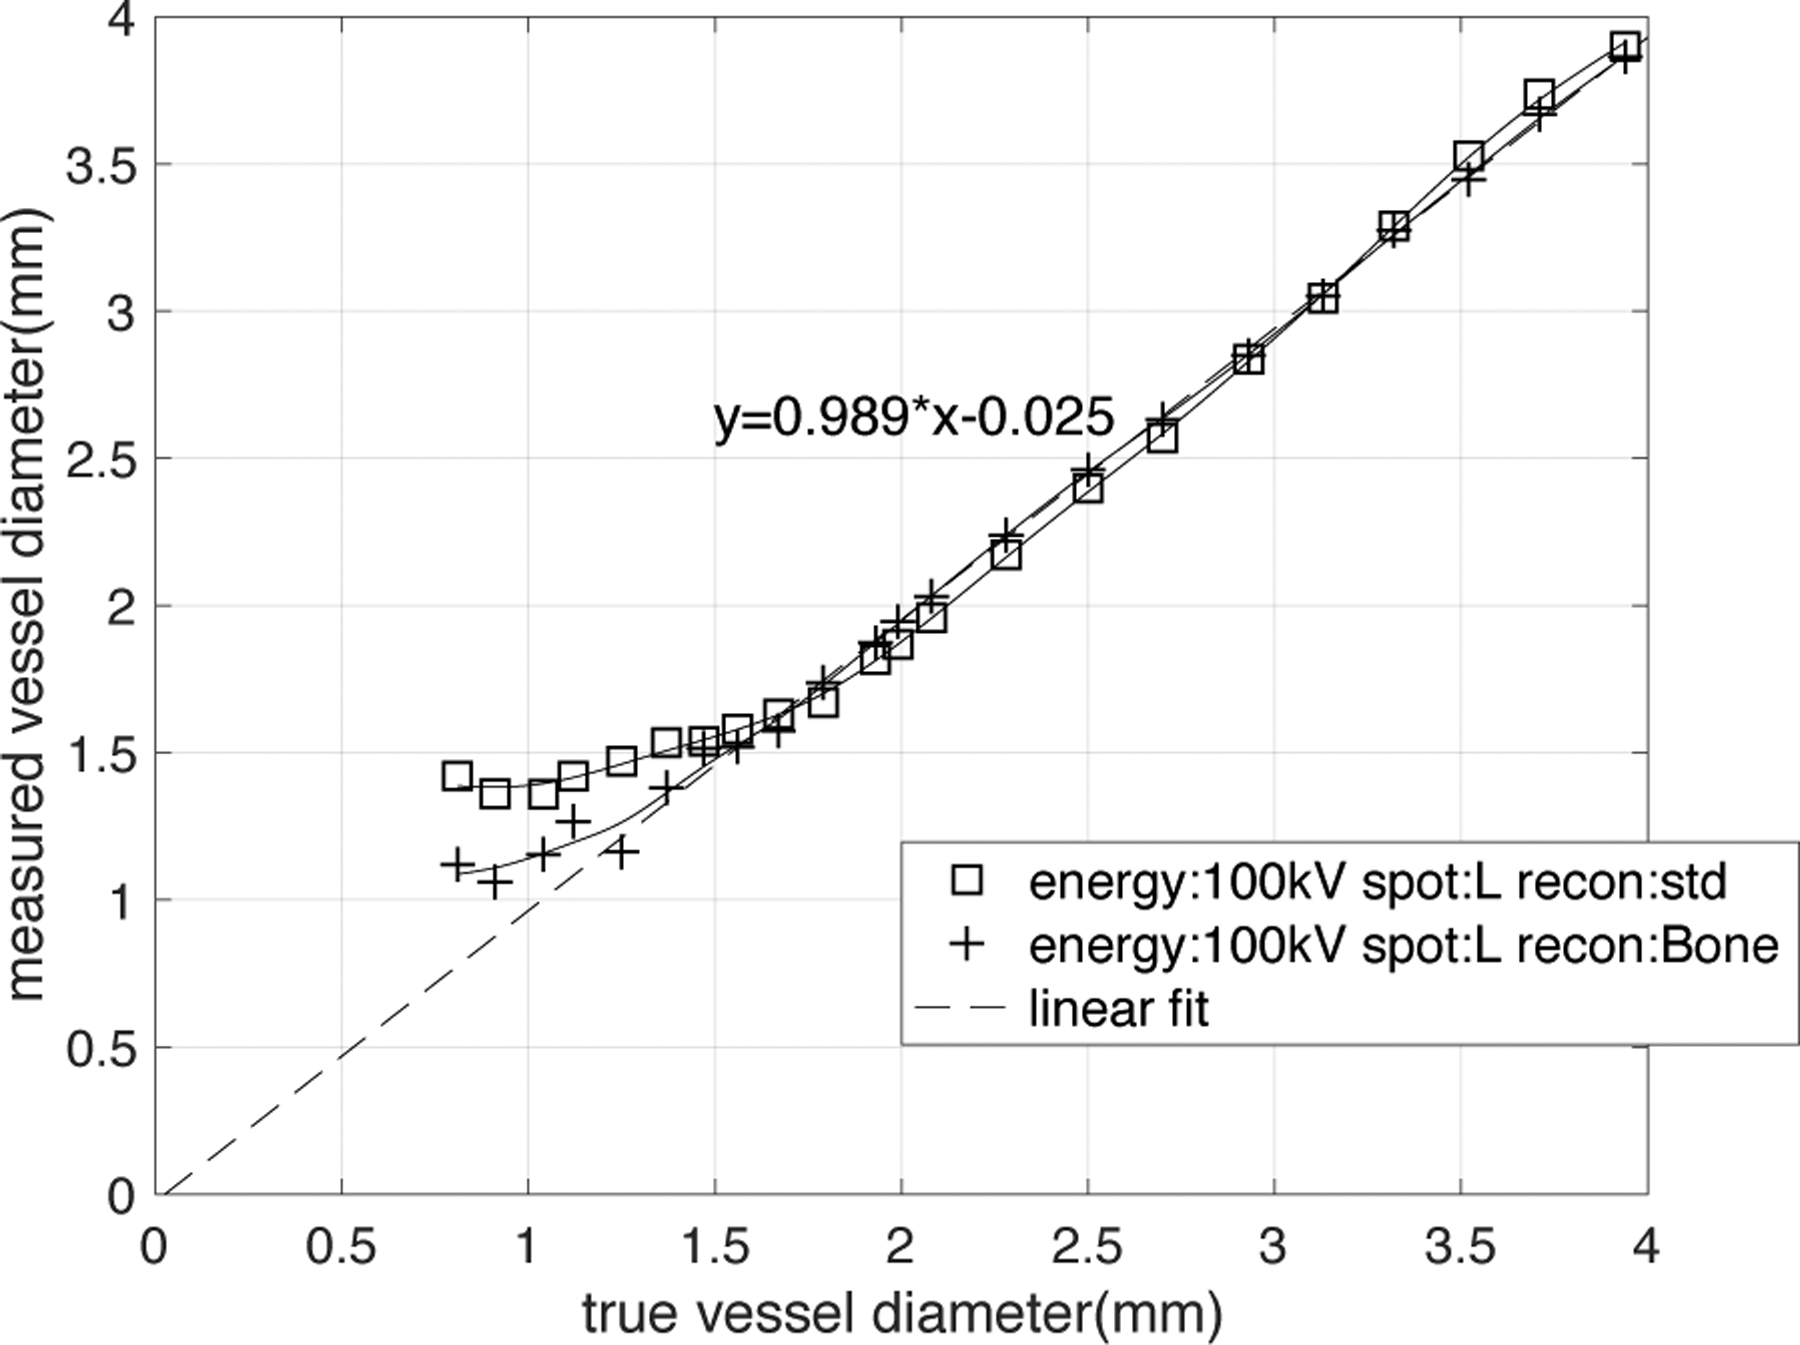
Figure 8:

FWHM calibration curve. True diameter measured from high-resolution cone-beam CT image. The measured diameter, DFWHM has a linear relationship (dashed line represents a linear fit, function: DFWHM=0.989×true diameter-0.025, R2 >0.999) with the true diameter for vessels larger than the cutoff diameter. When vessel diameter is smaller than cutoff diameter, the DFWHM will gradually approach an asymptotic value, causing an overestimation of lesion size. The shape of the FWHM calibration curve is significantly dependent on the choice of reconstruction kernel and thus spatial resolution.
