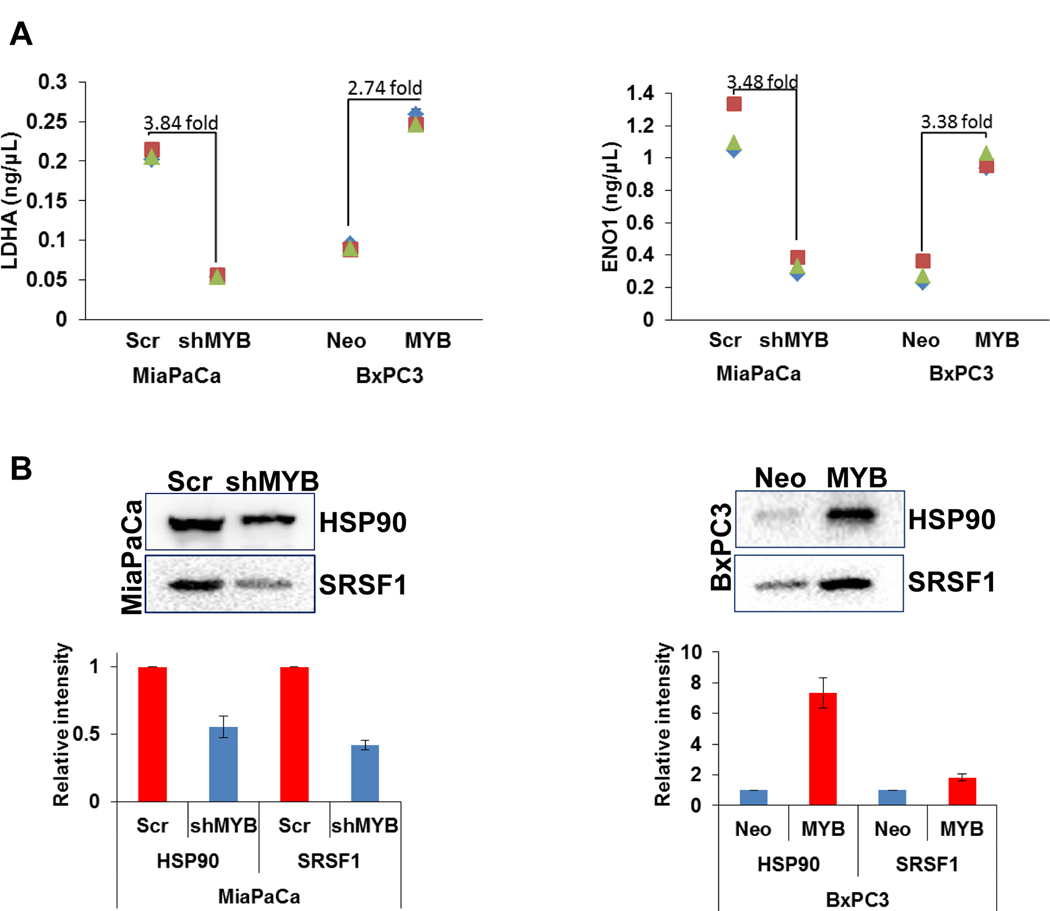
Figure 2: Measurement of differential levels of proteins by ELISA and immunoblooting in the conditioned media of MYB-modulated cell lines.
(A) Conditined media from cells was cleared for cells and debris and subjected to ELISA for LDHA and ENO1 meaurement as per manufacturer’s instructions. Experment was performed in triplicates in three biological replicates. Data (mean ± SD, n=3) is presented in a graph. (B) Conditioned media was concentrated (≈10X) from three biological replicates using size-based (3K cutoff) centrifugal flitration and subjected to western blot analyses for HSP90 and SRSF1. Representative image from one replicate is shown and the data from the densitometric analysis of three replicates (mean ± SD, n=3) has been plotted in the graph. * reflects statistically significant differences (p-value < 0.05).

