
Fig. 3.
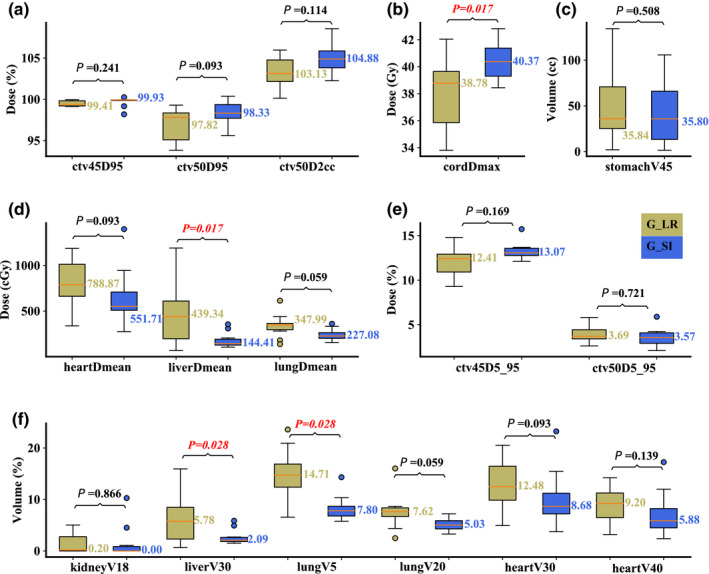
Comparison of the dose‐volume‐histogram indices between plans of Group S‐I and Group R‐L on the maximum inhalation phase. (a) Normalized CTVhigh D95% and CTVhigh D2cc, (b) spinal cord Dmax, (c) stomach V45Gy[RBE]cc, (d) heart Dmean, liver Dmean, and lung Dmean, (e) normalized CTVlow D5%‐D95% and CTVhigh D5%‐D95%, and (f) normalized volume of kidney V18Gy[RBE], liver V30Gy[RBE], lung V5Gy[RBE], lung V20Gy[RBE], heart V30Gy[RBE], and heart V40Gy[RBE]. Boxes in khaki are the results from Group R‐L, while blue boxes are the results from Group S‐I. Numbers on the top are P‐values from Wilcoxon signed‐rank test. P‐values that indicate statistical significance (<0.05) are in red and italicized.