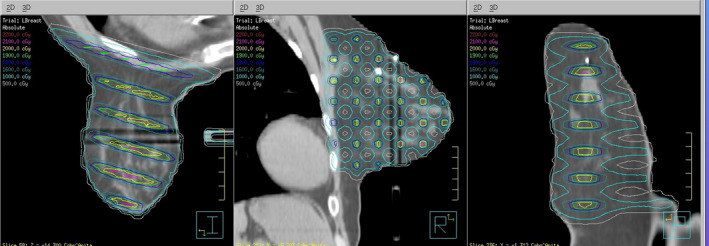
Fig. 2.

Typical isodose distribution from the corona, sagittal, and axial view. Two dark stripes shown in the breast are due to the artifacts caused by the breast support board. The mass density was changed by the artifacts from 0.9 to 0.8 g/cm3 in the dark strips the dosimetric impact was confirmed by treatment planning system as negligible.
