Fig. 2.

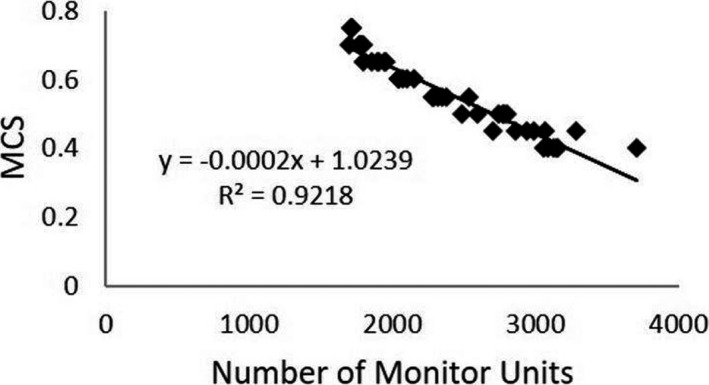
MCS vs MU. The relationship between the number of MU and the MCS is shown. The graph shows that there was a strong linear correlation (R = 0.92) between MCS and the number of MU.

MCS vs MU. The relationship between the number of MU and the MCS is shown. The graph shows that there was a strong linear correlation (R = 0.92) between MCS and the number of MU.