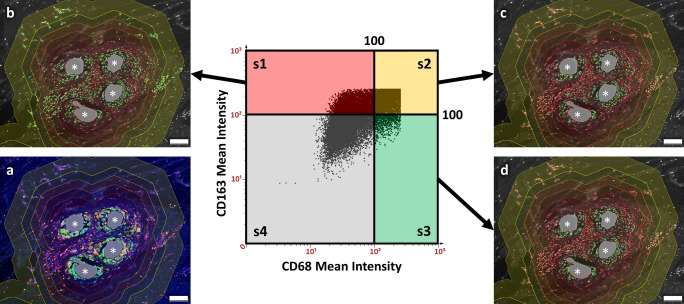
Fig. 3.
Backward gating of macrophages participating in the foreign body reaction. a Immunofluorescent labeling of a human mesh explant for CD68 (green), CD163 (red), and nuclei with DAPI (blue). (s1–s4) Scatter plot of the mean cell intensities with CD68 on the x axis and CD163 on the y axis. Cells with a mean staining intensity > 100 are considered to be “positive” and shown in green in the backward gating images (b–d). Backward gating of cells was done on DAPI grayscale images and compared with color images to verify detection. b Backward gating of CD163+ cells (= s1 and s2). c Backward gating of CD68+CD163+ M2 macrophages (= s2). d Backward gating of CD68+ macrophages (= s2 and s3). All images are superimposed with the regional zones of the Euclidean distance map that range from 0 to 50 µm (dark red) to 250–350 µm (bright yellow) in 50 µm steps. Mesh fibers are marked with asterisks, scale bars = 100 µm. Images of explant #3 (color figure online)

