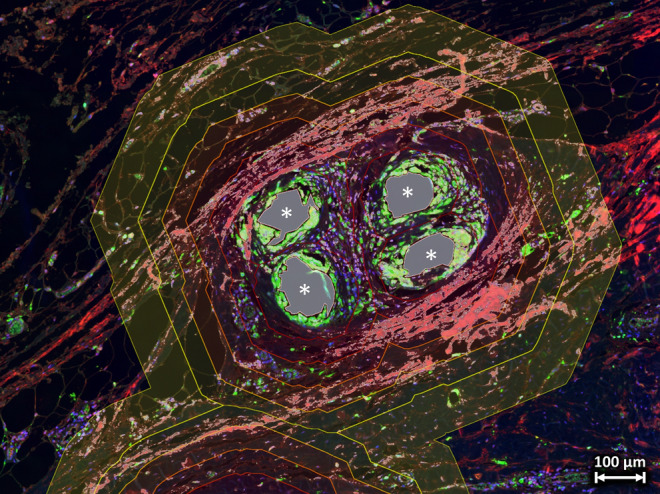
Fig. 4.

Collagen detection in the vicinity of mesh fibers. Double-stained tissue section of a human mesh explant labeled for CD68 (green) and collagen-III (red) with superimposed fiber areas in gray and the regional zones of the Euclidean distance map (0–50 µm in dark red to 250–350 µm in bright yellow). Detected collagen (pixel intensity > 100) within the zones is highlighted with a gray shade and the number of pixels was counted to determine the total collagen area in each regional zone. Mesh fibers are marked with asterisks. Image of explant #3 (color figure online)
