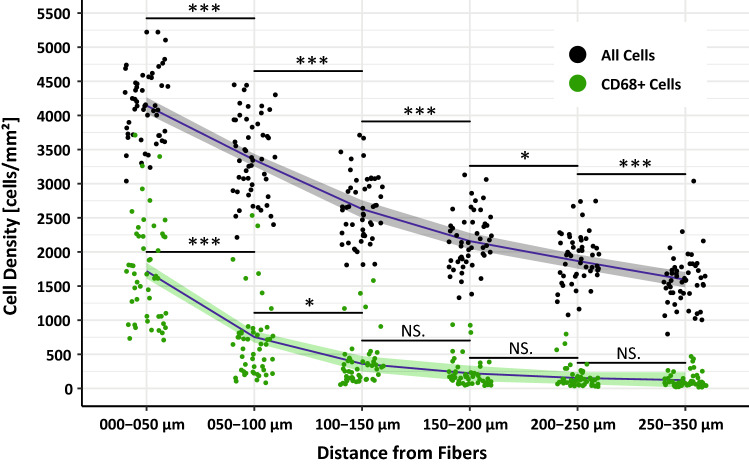
Fig. 5.
Spatial distribution of cell densities and macrophages at the mesh–tissue interface. Dots correspond to the mean cell densities (cells per mm2) of all cells and macrophages (CD68+) in each regional zone, e.g., 0–50 µm. Statistical significance between neighboring zones were determined with Welch-ANOVA followed by Dunnett’s T3 post hoc test (***p < 0.001, **p < 0.01, *p < 0.05, NS. = not significant). The gray- and green-shaded areas mark the 95% confidence interval of the respective mean values for macrophages and all cells (blue lines). N = 7 meshes each 7–9 stains (color figure online)

