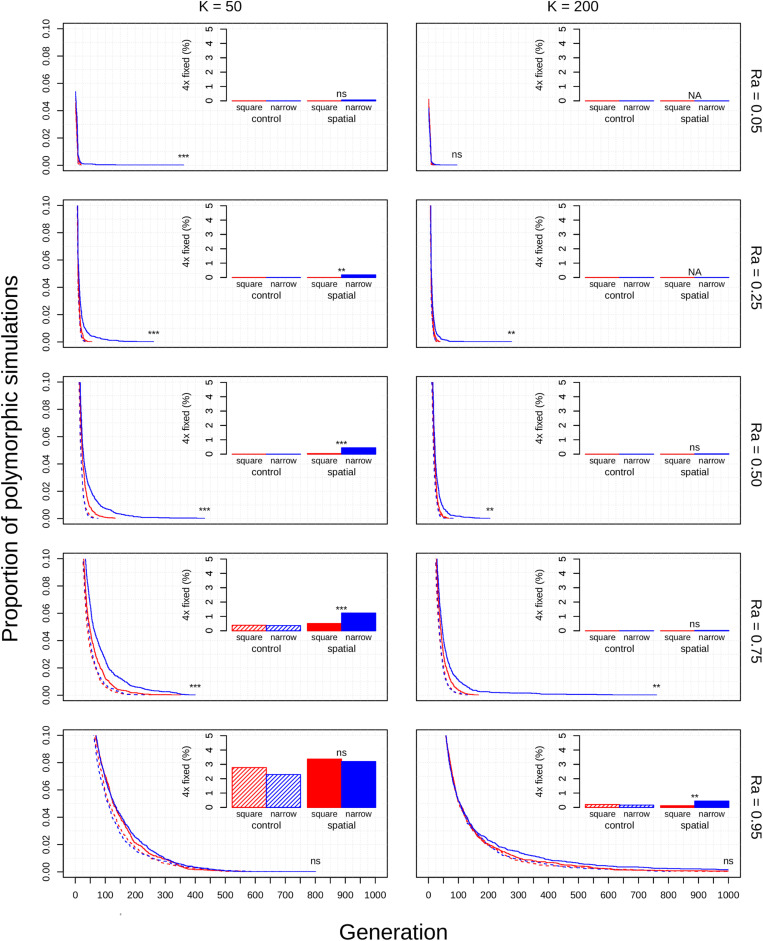
FIGURE 2.
Polyploid persistence and fixation in simulated perennial populations with selfing reproductive assurance. Values of K (columns) and Ra (rows) are noted in the margins. Each panel contains a survival plot showing the proportion of simulations that contained multiple cytotypes at each generation, and a bar plot showing the percentage of simulations that fixed as polyploid for each parameter combination. Results from non-spatial control simulations are shown as dashed lines and shaded bars, results from spatial simulations are shown as solid lines and solid bars, results from simulations in square habitats are shown in red, and results from simulations in narrow habitats are shown in blue. Asterisks denote the significance of log-rank tests (in survival plots) and Fisher tests (in bar plots) of differences between simulations in square and narrow habitats. Only results from simulations at a population density of 4.9% are shown. Significance: ns = p > 0.05; *p < 0.05; **p < 0.01; ***p < 0.001.

