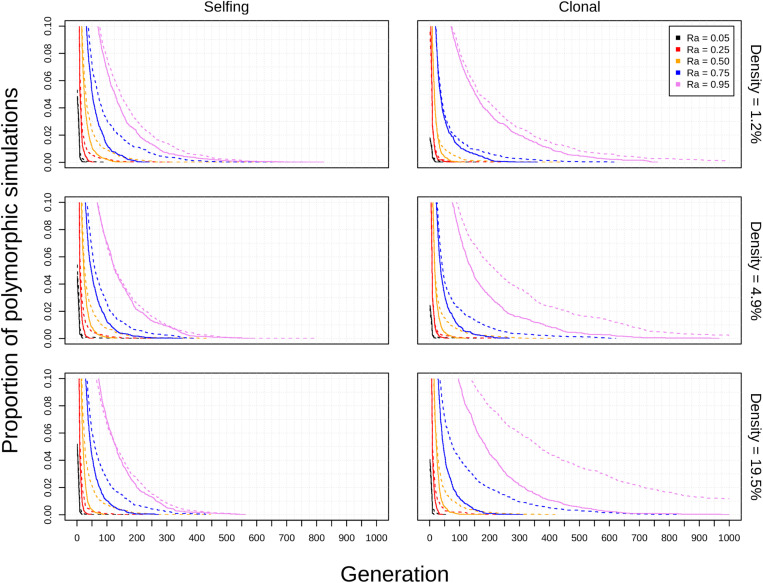
FIGURE 4.
Effects of population density on polyploid persistence in spatial simulations (K = 50). Model type (columns) and population density (rows) are noted in the margins. Each panel contains a survival plot showing the proportion of simulations that contained multiple cytotypes at each generation, with varying values Ra represented by different colors (see legend). Results from simulations in square habitats are shown as solid lines, and results from simulations in narrow habitats are shown as dotted lines.

