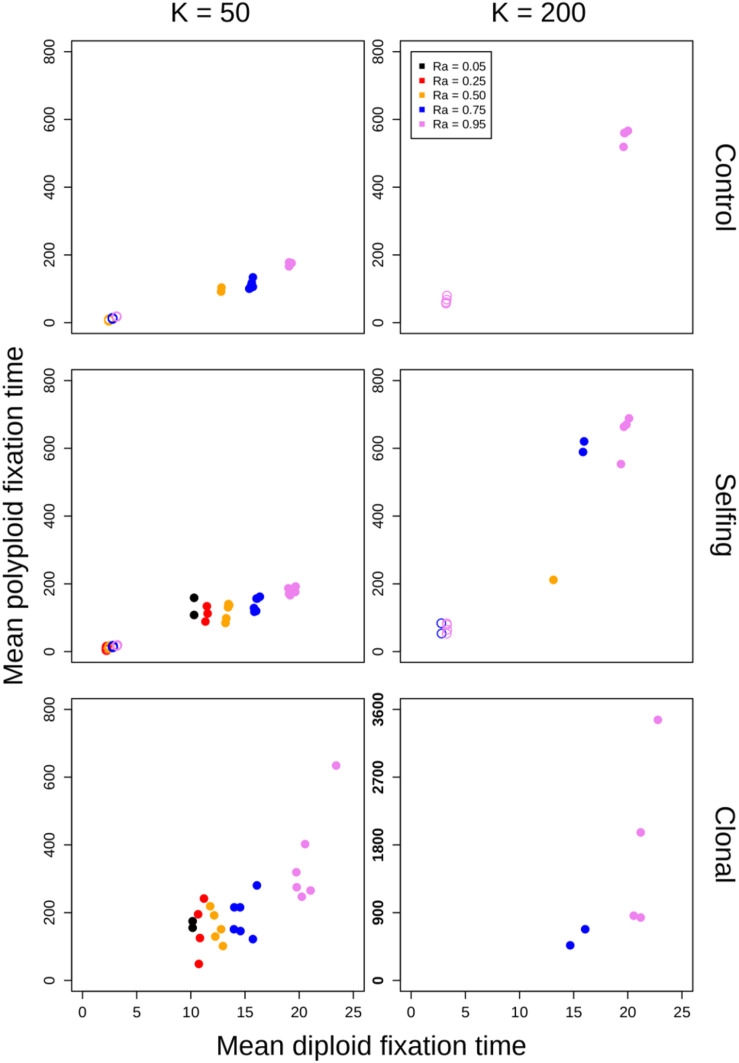
FIGURE 5.
Polyploid fixation time vs. diploid fixation time. Values of K (columns) and model type (rows) are noted in the margins. In each panel, the geometric means of polyploid fixation time for all parameter combinations are plotted against the geometric means of diploid fixation time for all parameter combinations. Open circles represent simulations of annual populations, and closed circles represent simulations of perennial populations. Note the different y-axis scaling in the plot showing clonal simulations at K = 200.

